
Someone asks for a quarterly video they can send beyond the reporting team. Sharing the whole workbook would expose customer details and invite viewers to interpret tabs they do not need. Start with the smallest approved extract that answers the actual question.
Define the metric before writing the headline
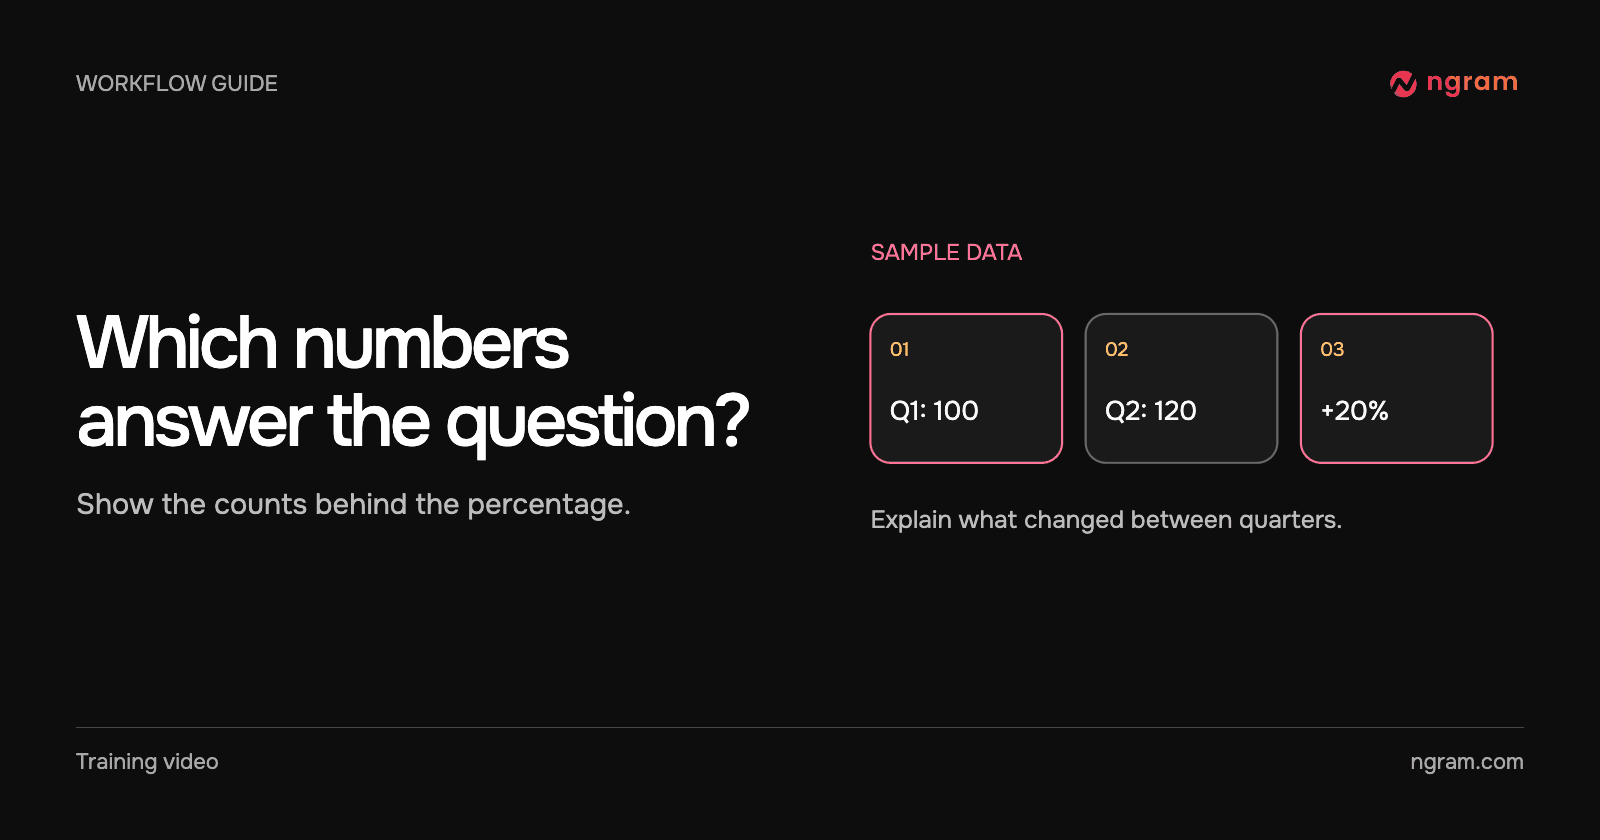
This worked example uses fictional customer success results labeled Sample data. The metric is accounts that completed onboarding in the quarter. The approved figures are 100 accounts in Q1 and 120 in Q2. Counts increased by 20 accounts. Relative to the Q1 count, that is a 20% increase: (120 − 100) ÷ 100 = 20%.
These figures describe quarterly counts, not a completion rate. A rate would require the number of eligible or starting accounts for each quarter, which the example does not provide. Do not invent that denominator or imply that a specific product change caused the increase.
Hand over the extract, not the workbook
Provide the metric name, units, periods, both values and the approved takeaway in plain text. Set the audience and the intended next action. Keep customer rows, hidden tabs, formulas and internal notes in the reporting system. The source material guide explains how to choose the inputs for a Studio project.
In the brief, request a clearly labeled sample, a consistent scale for the two values and a separate closing line: “Next quarter, help more accounts finish onboarding.” The line is a goal, not a forecast or an additional reported result.
The finished video labels its figures Sample data. The final bars show Q1 at 100 and Q2 at 120, with a 20% increase. The closing card says, “Next quarter: help more accounts finish onboarding.” The Studio project used the approved written extract.
Review the cut like a report
Pause on every number and compare it with the approved extract. Check the spoken words, labels and chart. If the voice says “20 percentage points,” correct it; the sample shows a relative increase in a count. If the chart implies a monthly trend, remove it; only two quarterly totals were supplied. Give the reporting owner the exact source calculation and current cut for review.
For an internal team update, put the source date and reporting owner in the accompanying note. Use the sharing guide to select the audience for the video. Keep the detailed workbook in its existing access-controlled location.