
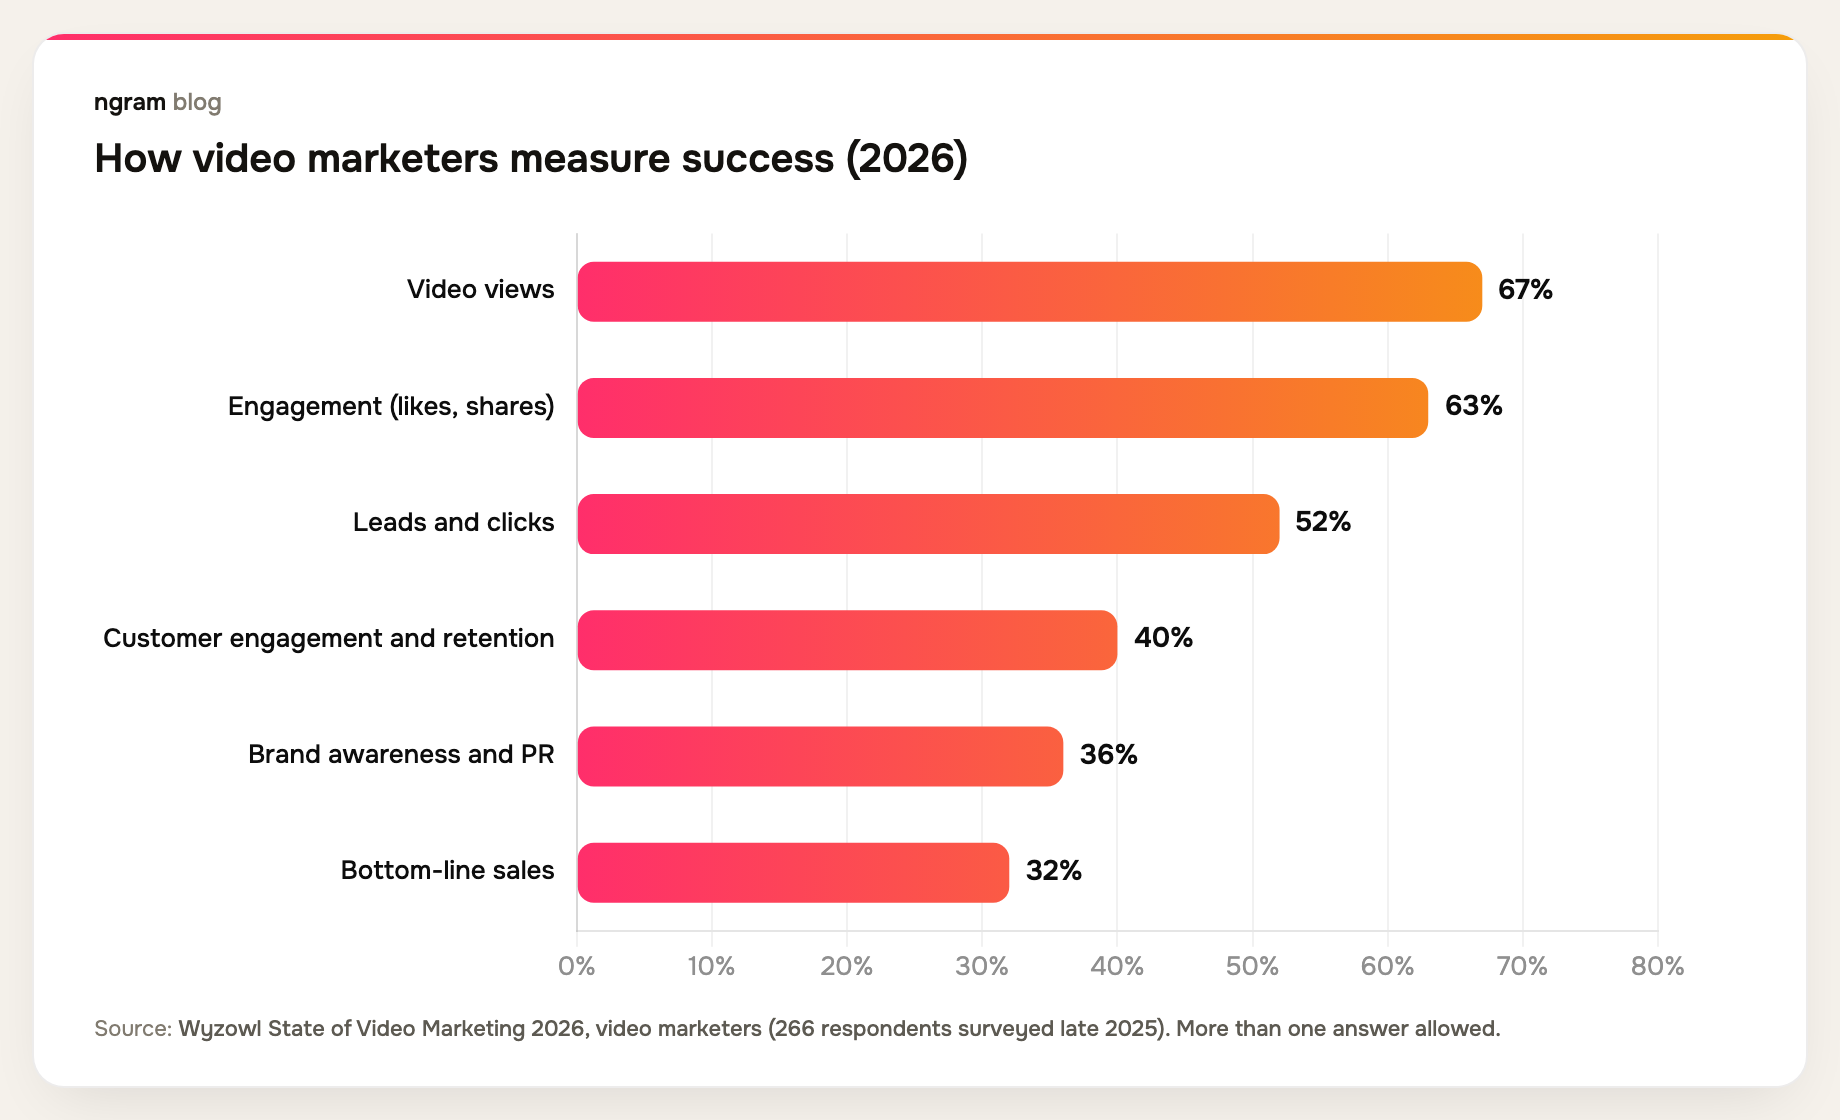
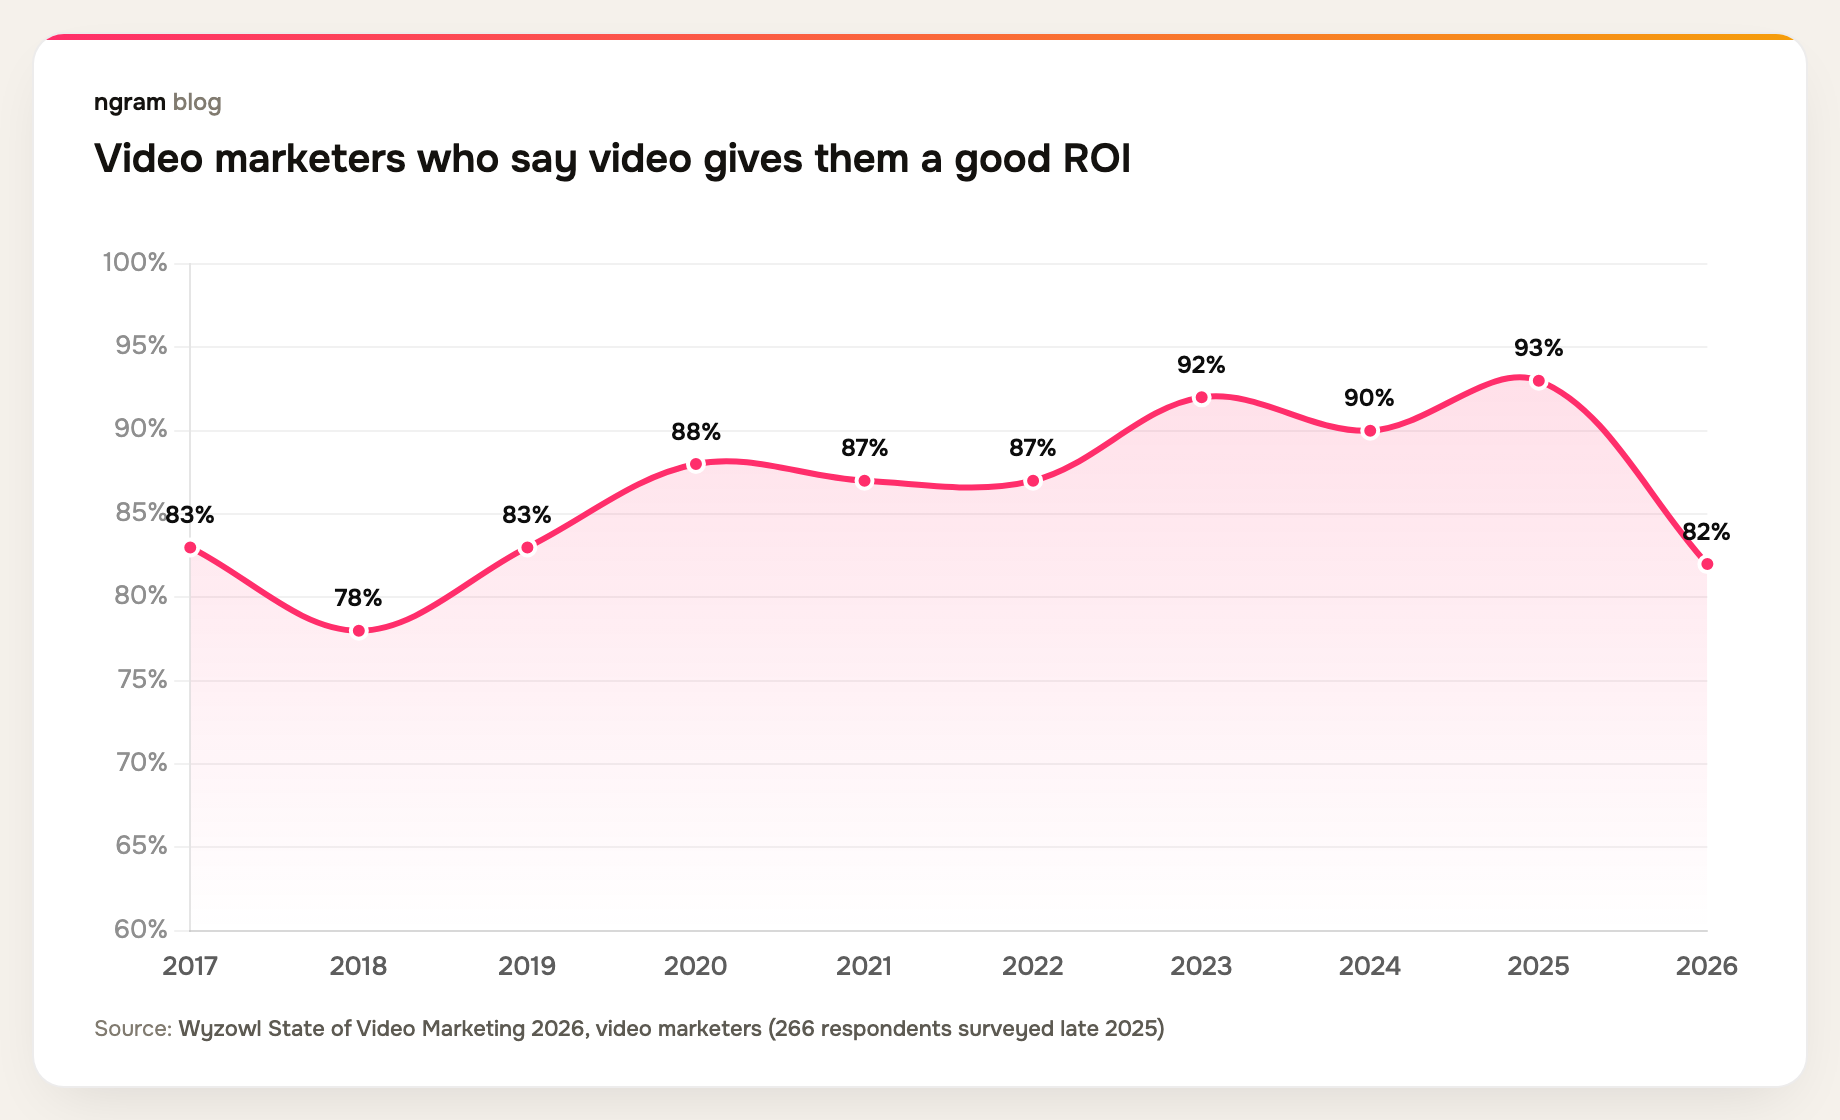
Most teams track video metrics they can't act on. In Wyzowl's 2026 survey of video marketers, views were the most common measure of success at 67%, while only 32% measured bottom-line sales. The share who said video gives them a good return fell to 82%, from 93% a year earlier.
A number earns its place on your dashboard when it changes what you do next. This guide maps each video metric to the decision it informs, for the videos you host yourself and send to buyers, customers and website visitors, rather than videos posted to social feeds.
The video metrics that matter, and what each one tells you to do
Eight video metrics cover almost every decision a business team makes about a hosted video. Play rate shows whether people press play, retention shows where they leave, and named viewers show who is interested. The table pairs each metric with the action it should trigger.
| Metric | What it tells you | What to do next |
|---|---|---|
| Play rate | Whether visitors choose to press play | Change the poster frame or title, or move the player higher on the page |
| Plays and unique viewers | How many people the video reached | Compare with how many people you sent it to or how many visited the page |
| Completion | Whether the length fits the audience | Cut the video shorter, or split it into two |
| Audience retention | The moment people stop watching | Fix or cut that moment |
| Replays and skips per viewer | What a person rewatched or jumped past | Answer that part directly in your follow-up |
| Named viewer watched | A specific buyer or customer is engaged | Follow up while the video is fresh |
| Call-to-action clicks | Whether watching turned into action | Test the button's wording, timing or destination |
| Traffic source, device and location | Where viewers come from and how they watch | Put effort into the channels that bring people who finish |
Why views are the weakest video metric on their own
A view only proves the video started. Whether the right person watched, reached the part that matters or did anything next shows up in other numbers. On social platforms each network even defines a view differently, which makes cross-channel totals hard to compare.
For a video you send or embed, treat views as the starting count. Divide plays by the number of people who saw the player and you get play rate. Divide watch time by video length and you get completion. Those two ratios tell you more than the raw total.
Video engagement metrics: play rate, completion and retention
Play rate
Play rate is plays divided by the number of times the player loaded. A low play rate on a page that gets traffic usually means the video isn't earning a click: the poster frame looks generic, the title doesn't match what the visitor came for, or the player sits too far down the page.
Completion
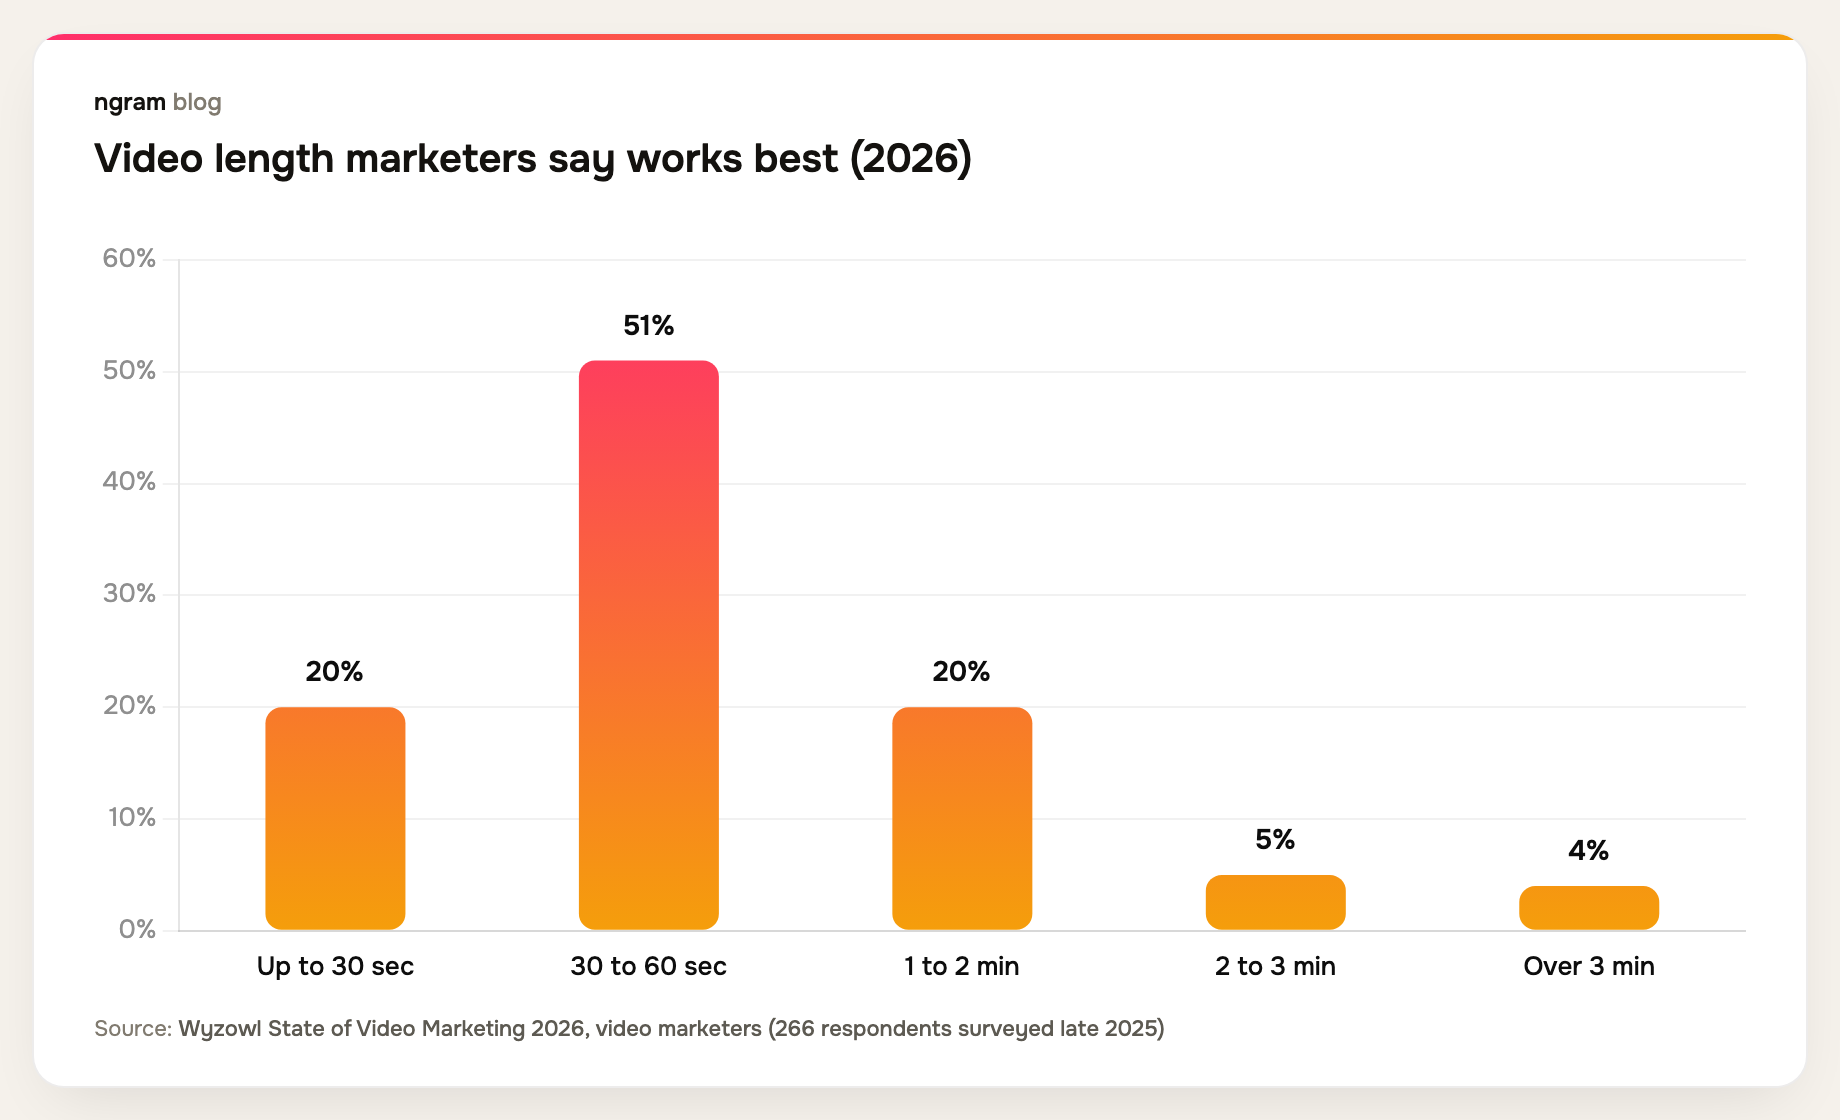
Completion is the share of the video people watch, on average. There is no universal benchmark, because a 30-second clip and a 10-minute walkthrough behave differently, so compare each video against your own videos of a similar length. Length is the usual lever: in Wyzowl's survey, 71% of marketers said videos between 30 seconds and 2 minutes work best.
Audience retention
Audience retention, the curve of how many people are still watching at each second, is the most actionable video engagement metric. A steep drop in the first seconds means the opening doesn't match the promise. A cliff in the middle points at one scene: a long intro, a confusing screen or a section that belongs in another video.
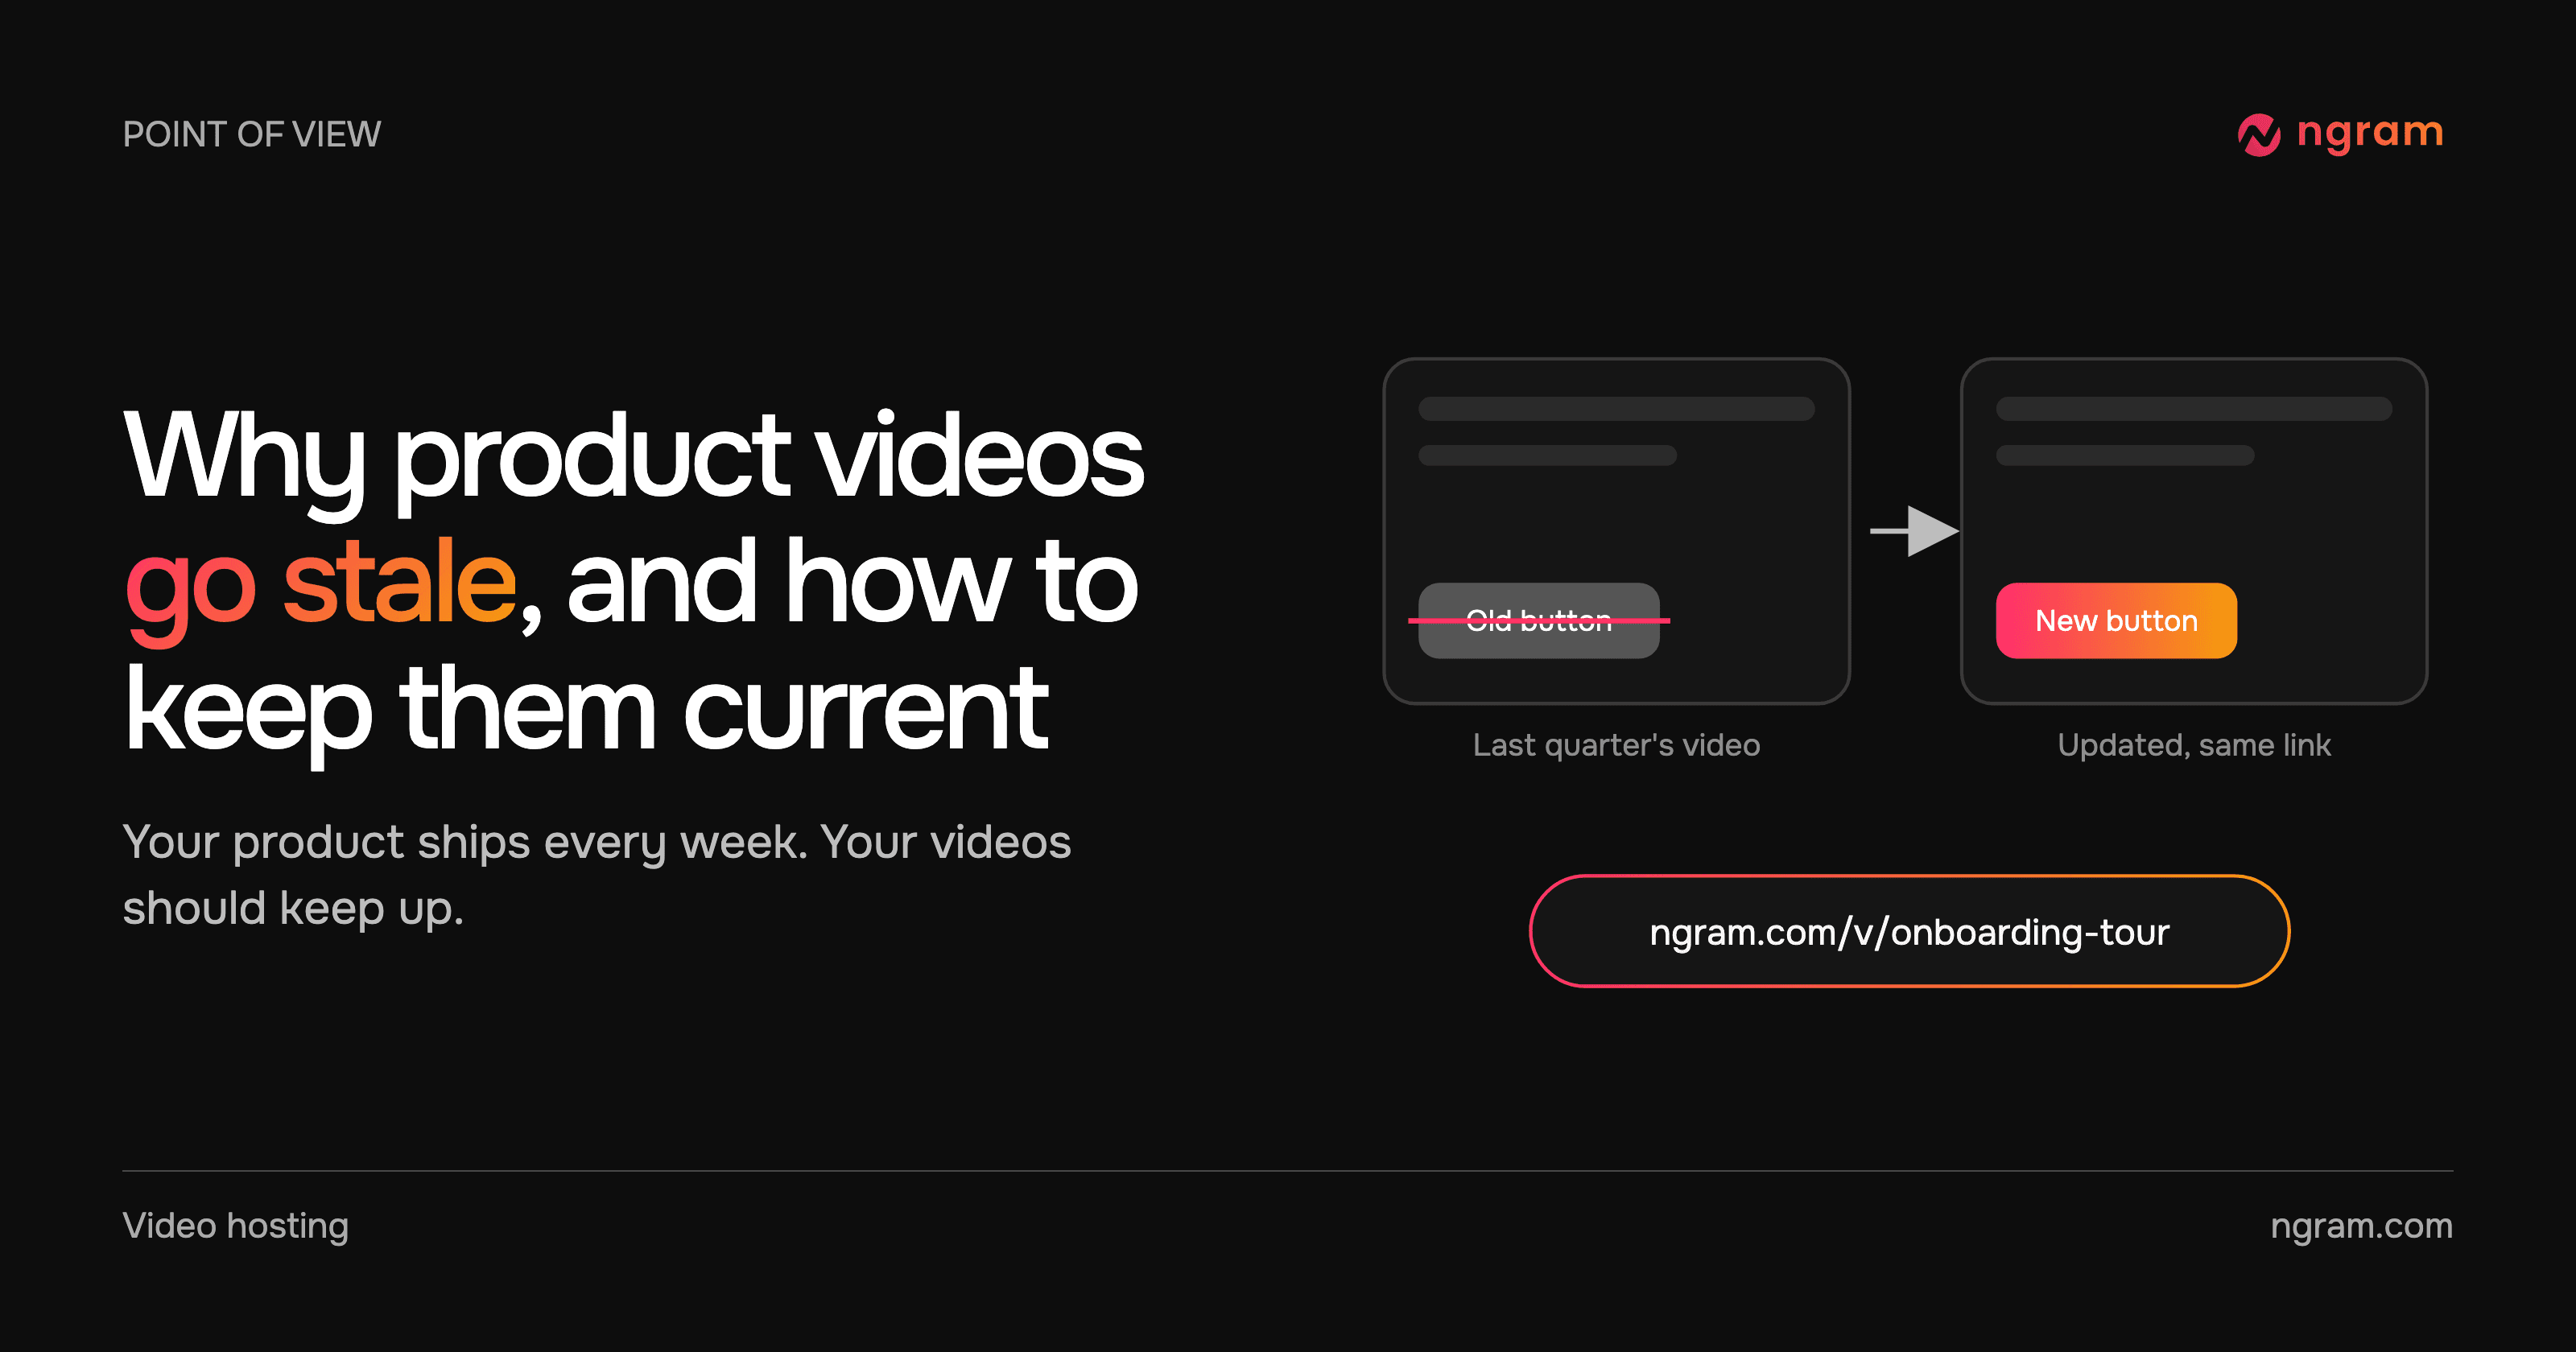
Fixing that scene used to mean re-editing the video and replacing it everywhere it was shared. In ngram, you ask for the change in plain words, check the new version and choose Update, and the link and embeds you already shared play the new cut.
Who watched: the metric that turns a video into a follow-up
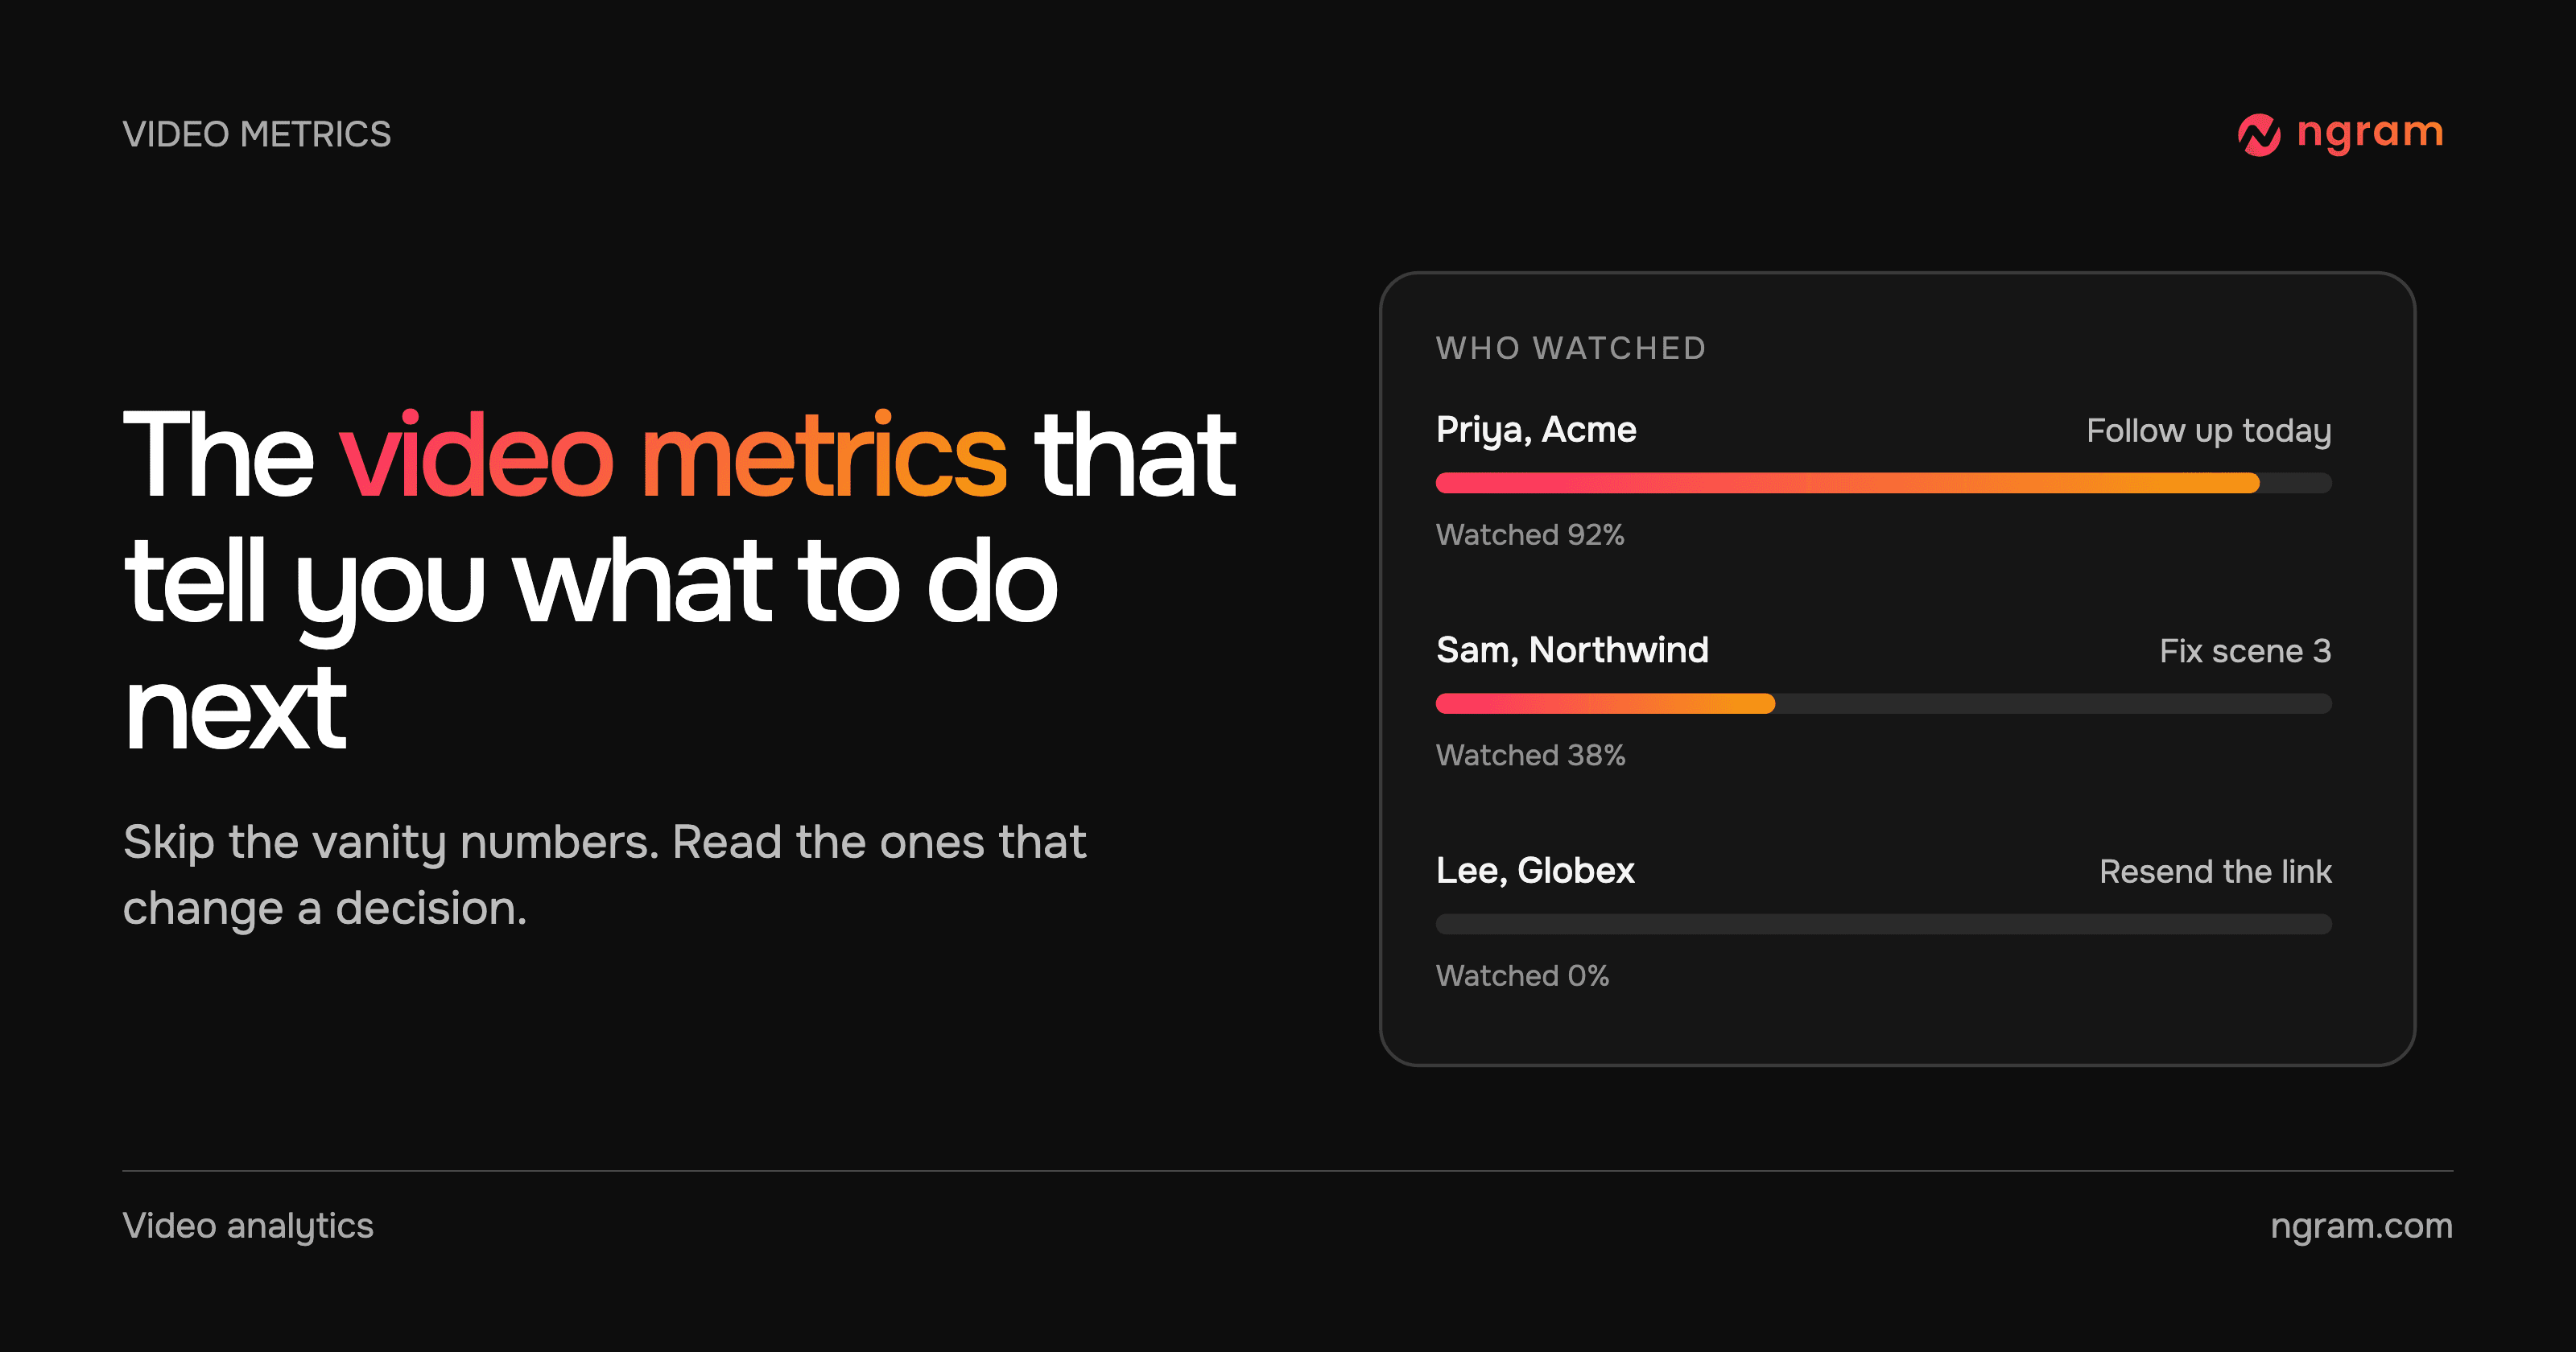
Totals can't tell a sales rep which buyer to call. A link made for one person can. When each recipient gets their own link, you see who opened the video, how far they got and which parts they replayed, so a demo recap tells you who to call first.
Use it where one viewer's attention matters: a demo follow-up for a buyer, an onboarding video for a new customer, or a proposal walkthrough for an approver. A shared or unlisted link can't do this, because anyone with that link can watch and you can't tell them apart.
Want to know who watched before you follow up? ngram gives each person their own link and shows how far they got. See how video hosting works in ngram.
Video KPIs by team
Choose one or two video KPIs per video, based on its job, and ignore the rest for that video.
- Sales: named viewers, how much each watched and which parts they replayed. The action is the next conversation.
- Customer success and support: completion of onboarding and how-to videos, and the scene where people drop off. In Wyzowl's survey, 57% of marketers said video reduced support queries. Teams building onboarding programs for customer success should watch completion closely.
- Marketing: play rate on the page, completion, and call-to-action clicks. For product marketing launches, compare play rate across the pages where the same video is embedded.
Measuring video ROI without drowning in dashboards
Confidence in video's return slipped in 2026. In Wyzowl's survey, 82% of marketers said video gives them a good ROI, down from 93% in 2025, and 17% weren't tracking what they spend on video at all.
A simpler habit holds up better than a bigger dashboard. Write down each video's job before you publish it, pick the one metric that shows whether it's doing that job, and review it monthly. If the number doesn't move a decision for three months in a row, stop reporting it.
Where ngram shows these video metrics
ngram shows video analytics on each hosted video's page, at the depth of your plan. The guide to protecting links and reading viewer analytics walks through each screen.
- Every plan: plays, unique viewers, loads and play rate for each hosted video.
- Premium and higher: a separate link for each person, attention and completion, a retention curve once a video has 100 qualified sessions, and a heatmap for each viewer.
- Ultimate: scene drop-off, call-to-action results, traffic source, device and geography.
Because the same place makes and hosts the video, a drop-off on one scene leads straight to a fix: ask ngram to change that scene and update the link.
Frequently asked questions
What are the most important video metrics?
For business video, the most useful are play rate, completion, audience retention and, for videos sent to one person, who watched and how much. Views on their own rarely change a decision.
What is play rate?
Play rate is the number of plays divided by the number of times the video player loaded. It shows whether people who could watch actually chose to press play.
What is audience retention in video?
Audience retention shows how many viewers are still watching at each point in the video. Drops in the curve show the exact moments people leave, which tells you what to fix or cut.
What is a good video completion rate?
There is no single benchmark, because completion depends on length, audience and where the video plays. Compare each video with your own videos of a similar length, and look at where people drop off rather than the average alone.
What are video KPIs?
Video KPIs are the few video metrics tied to a video's goal, such as play rate for a landing-page video, completion for onboarding, or named viewers for a sales follow-up. Pick one or two per video.
How can I see who watched my video?
Send each person their own link instead of one shared link. In ngram, recipient links on Premium and higher show who opened the video, how far they got and which parts they replayed, and can alert you when someone presses play.
Ready to see who watched your next video? Try ngram free and share it from Hosted videos.