Physical Product Video Brief for X | product walkthrough video made with ngram

About the video
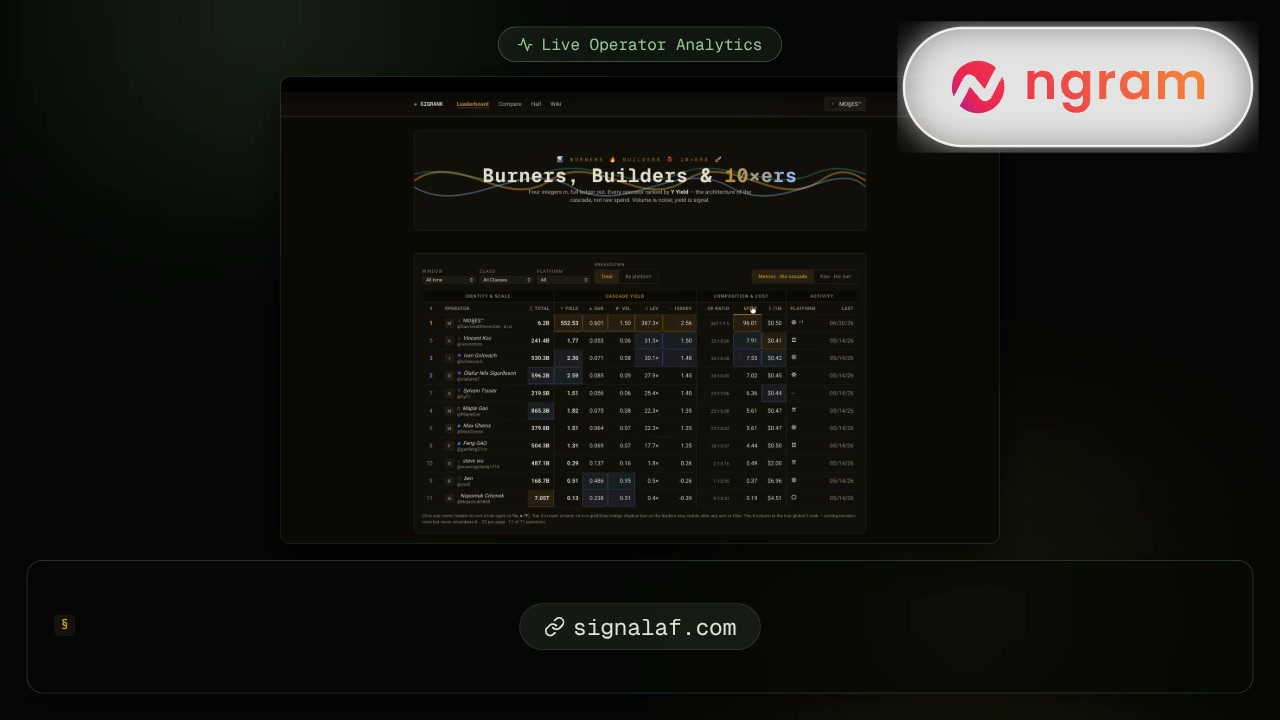
This product walkthrough video was made with ngram to walk through the SIGRANK leaderboard, a dashboard for analyzing operator performance. The video starts on the Raw Data view, showing trading or usage volume with highs, lows, and midstream fluctuations, and demonstrates sorting the table by metrics like cost, cache reads, and inputs to reorder the rankings. It then switches to the Metrics tab, where the dashboard updates with advanced columns such as yield, signal-to-noise ratio, and other operational ratios. The video closes by directing viewers to explore and filter these operator analytics themselves at signalaf.com and to join the leaderboard to see where their own signal ranks. The takeaway is a quick orientation to the dashboard's two core views, raw volume data and derived performance metrics, and how to use sorting and filtering to compare operator performance.
- Sigrank
- Operator Leaderboard
- Dashboard Walkthrough
- Signal-To-Noise Ratio
- Data Sorting
- Signalaf