Social Media Analytics Dashboard Overview | agency social content video made with ngram

About the video
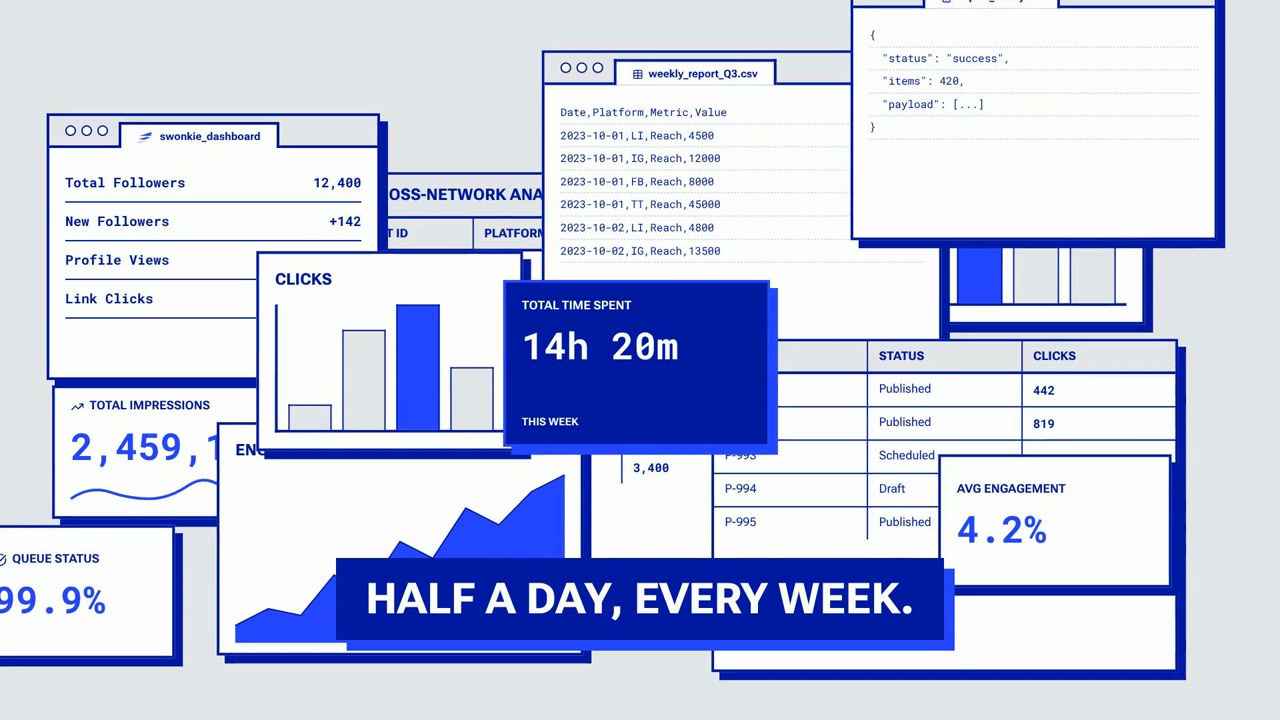
This agency social content video was made with ngram to show how a social media management tool brings cross-network analytics, scheduling, and reporting together in one dashboard. The animated screens display stacked ui panels for a product called swonkie_dashboard, including total followers, new followers, profile views, link clicks, total impressions, clicks charts, average engagement percentage, queue status, and a weekly_report_q3.csv file with platform metrics for linkedin, instagram, facebook, and tiktok reach. A cross-network analytics table lists account ids, platforms, and follower counts, alongside a weekly reach bar chart and a json code snippet showing a success status response. Bold on-screen text callouts read total time spent 14h 20m this week, half a day every week, monday morning, and six client accounts, framing the narrative around the time cost of managing multiple client social accounts manually. A later scene uses a simple flow diagram with a lightning-bolt icon labeled reads what performed, connecting bars representing data on the left to four output nodes on the right, suggesting an automated process that analyzes performance data and distributes it to multiple destinations or formats. The overall style is flat, blue-and-white line art with clean sans-serif typography, consistent with a software explainer aimed at marketing or social media teams managing several accounts.
- Social Media Dashboard
- Analytics
- Cross-Network Reporting
- Engagement Metrics
- Data Visualization
- Scheduling Tool
- Flat Design Animation