Revuze Video Case Study | agency case study video made with ngram

About the video
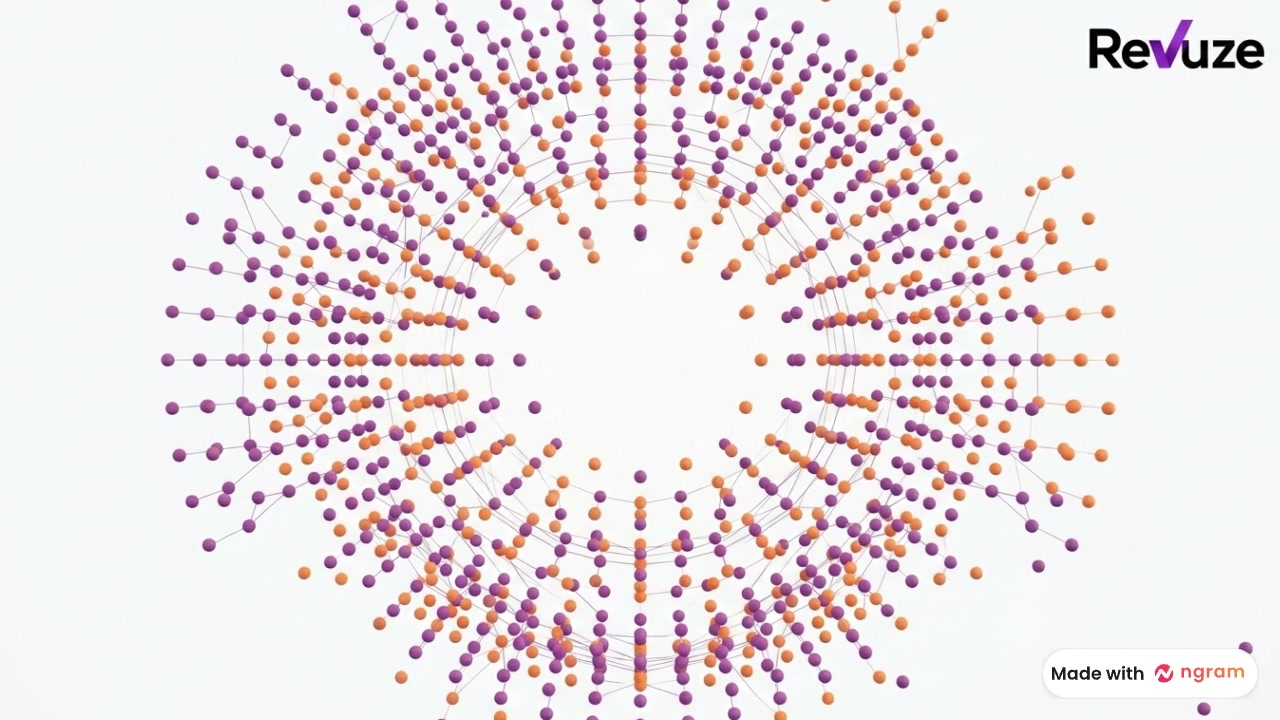
This agency case study video was made with ngram to illustrate how consumer review data can be visualized and analyzed. The video opens with a stylized dark product shot of a running shoe, setting a premium visual tone, before transitioning to the Revuze brand mark alongside an animated network of connected purple and orange nodes, suggesting the aggregation and clustering of data points such as customer reviews or sentiment signals. The final scene shows a simple purple bar chart with ascending values, representing growth or an upward trend in a key metric over five periods. Together these scenes form a brief visual case study narrative: a product is reviewed, the resulting feedback is processed into structured data, and that data reveals measurable improvement or growth. The motion graphics style relies on clean white and dark backgrounds, minimal text, and abstract data visualizations rather than live-action footage or voiceover, positioning this as a brand or product explainer centered on Revuze's data analysis capabilities applied to a product example like footwear.
- Revuze
- Data Visualization
- Case Study
- Bar Chart
- Network Graph
- Running Shoe
- Brand Animation