Animated Data Visualization Brief | saas explainer video made with ngram

About the video
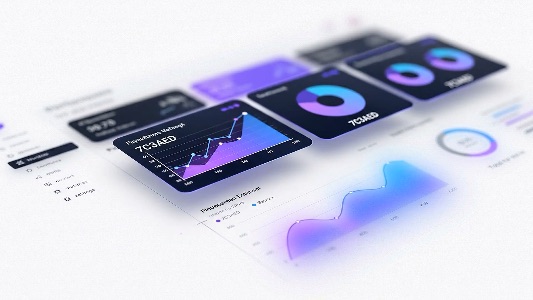
This saas explainer video was made with ngram to explain the value of ai-harness, a platform that gives teams real-time visibility into ai-powered workflows. the fifteen-second animation shows key performance metrics rising, workflow stages lighting up in sequence from left to right, and pie chart segments filling in to represent progress. cost comparison bars contrast ai performance in purple against human benchmarks in blue, making efficiency differences visually clear, while a data refresh animation reinforces the platform's live operational insight. designed for a linkedin audience of team leads, operations managers, and ai strategists, the video communicates accountability, transparency, and control over every workflow step in a format built to stop the scroll. it closes by directing viewers to learn more about full operational visibility at the ai-harness website.
- AI Harness
- Data Visualization
- Workflow Analytics
- LinkedIn Video
- Operational Visibility