| __timestamp | AECOM | Lennox International Inc. |
|---|---|---|
| Wednesday, January 1, 2014 | 80908000 | 573700000 |
| Thursday, January 1, 2015 | 113975000 | 580500000 |
| Friday, January 1, 2016 | 115088000 | 621000000 |
| Sunday, January 1, 2017 | 133309000 | 637700000 |
| Monday, January 1, 2018 | 135787000 | 608200000 |
| Tuesday, January 1, 2019 | 148123000 | 585900000 |
| Wednesday, January 1, 2020 | 188535000 | 555900000 |
| Friday, January 1, 2021 | 155072000 | 598900000 |
| Saturday, January 1, 2022 | 147309000 | 627200000 |
| Sunday, January 1, 2023 | 153575000 | 705500000 |
| Monday, January 1, 2024 | 160105000 | 730600000 |
Unlocking the unknown
In the competitive world of business, managing Selling, General, and Administrative (SG&A) expenses is crucial for maintaining profitability. This analysis compares the SG&A cost optimization strategies of Lennox International Inc. and AECOM from 2014 to 2024. Over this decade, Lennox International Inc. consistently reported higher SG&A expenses, peaking at approximately 730 million in 2024, a 27% increase from 2014. In contrast, AECOM's SG&A expenses grew by nearly 98% over the same period, reaching around 160 million in 2024. While Lennox's expenses are higher in absolute terms, AECOM's rapid increase suggests a need for more stringent cost control measures. This data highlights the importance of strategic financial management in sustaining long-term growth and competitiveness. As businesses navigate economic fluctuations, optimizing SG&A costs remains a key focus for enhancing operational efficiency and shareholder value.
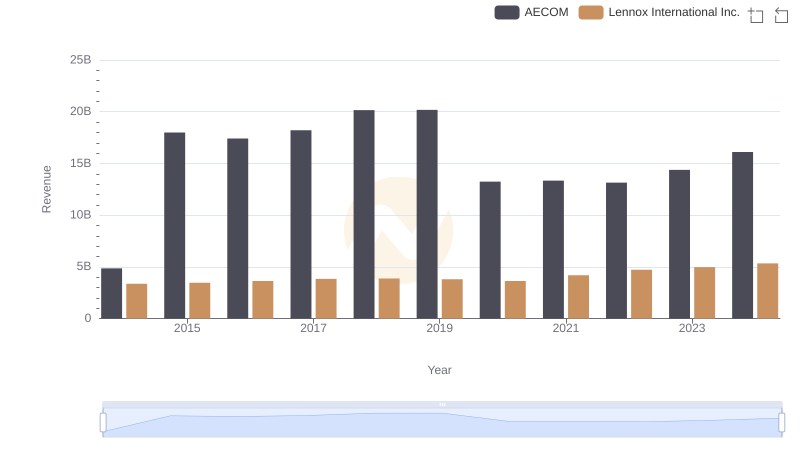
Lennox International Inc. vs AECOM: Examining Key Revenue Metrics
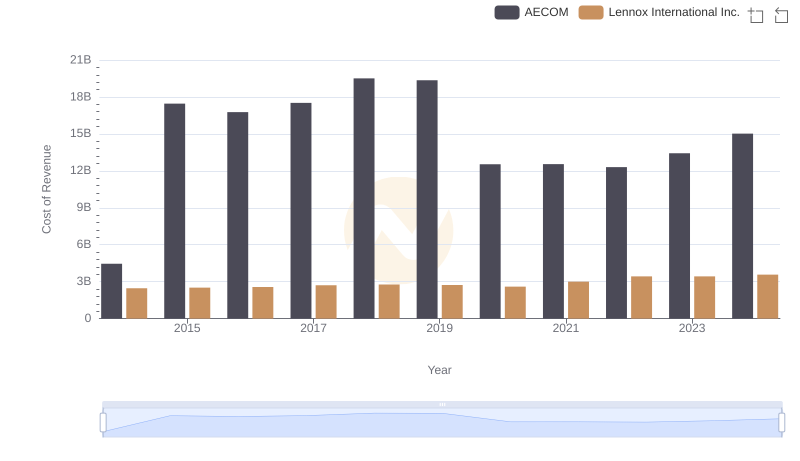
Cost of Revenue Trends: Lennox International Inc. vs AECOM
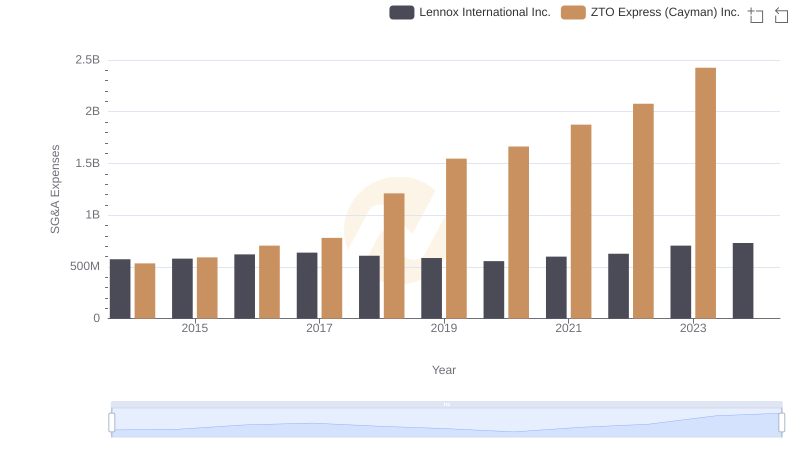
Operational Costs Compared: SG&A Analysis of Lennox International Inc. and ZTO Express (Cayman) Inc.
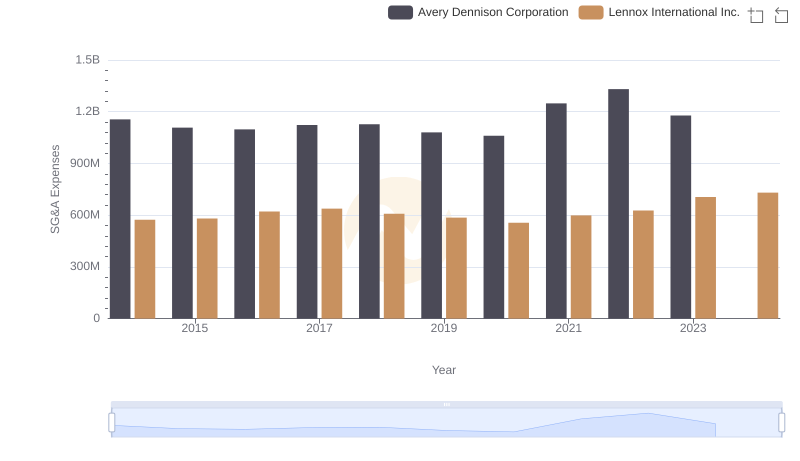
Operational Costs Compared: SG&A Analysis of Lennox International Inc. and Avery Dennison Corporation
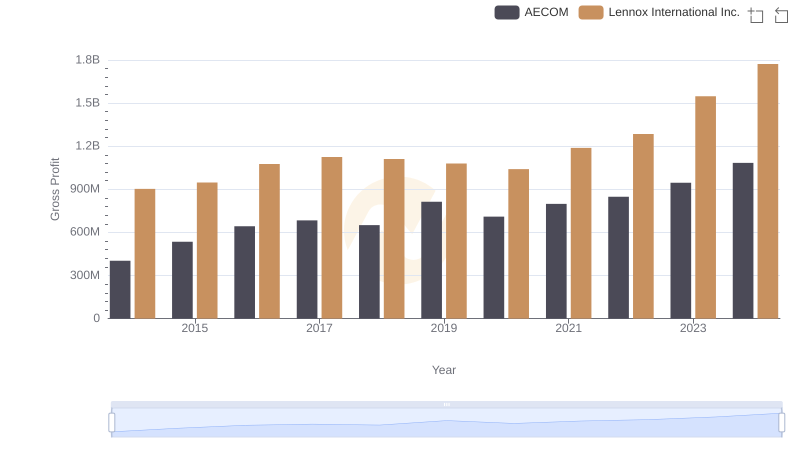
Lennox International Inc. vs AECOM: A Gross Profit Performance Breakdown
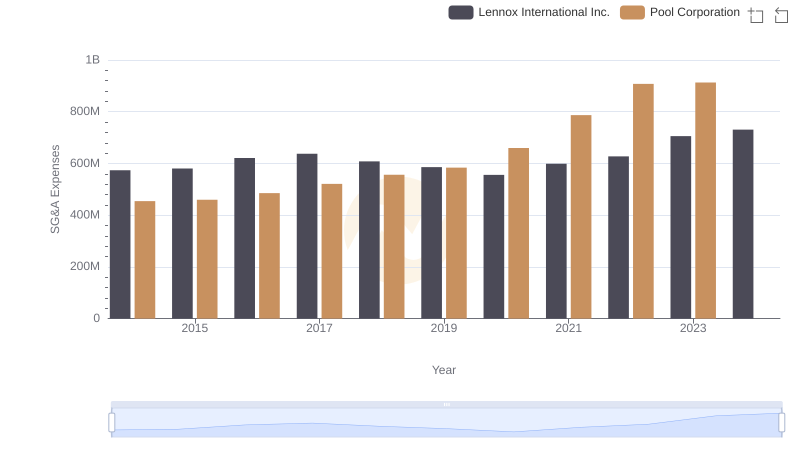
Selling, General, and Administrative Costs: Lennox International Inc. vs Pool Corporation
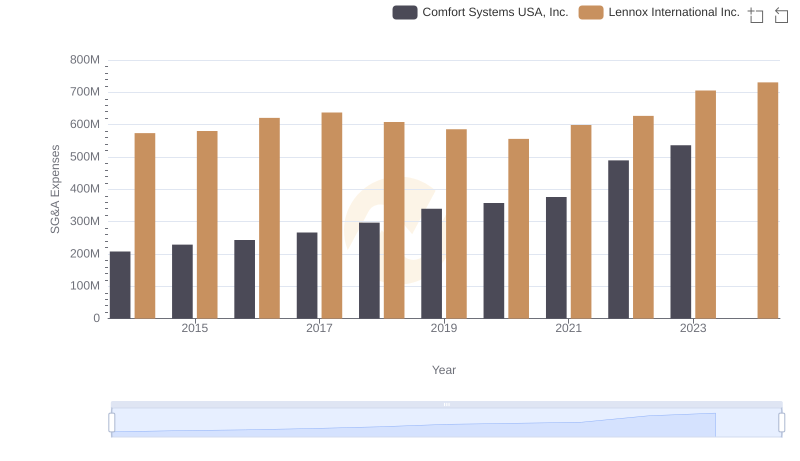
Selling, General, and Administrative Costs: Lennox International Inc. vs Comfort Systems USA, Inc.
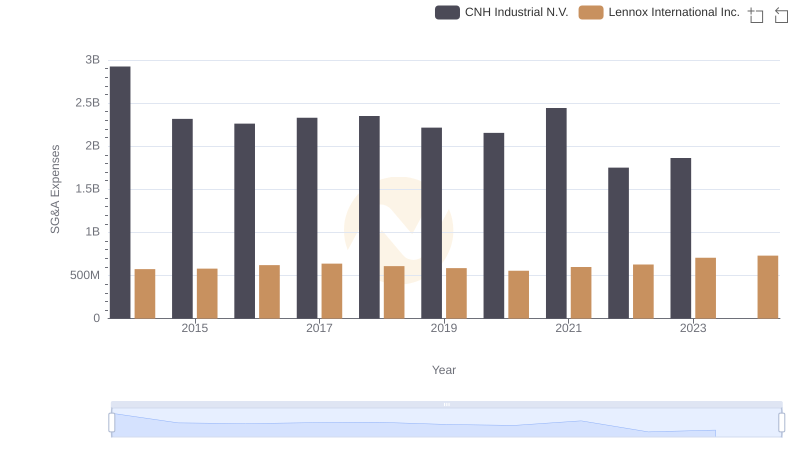
Breaking Down SG&A Expenses: Lennox International Inc. vs CNH Industrial N.V.
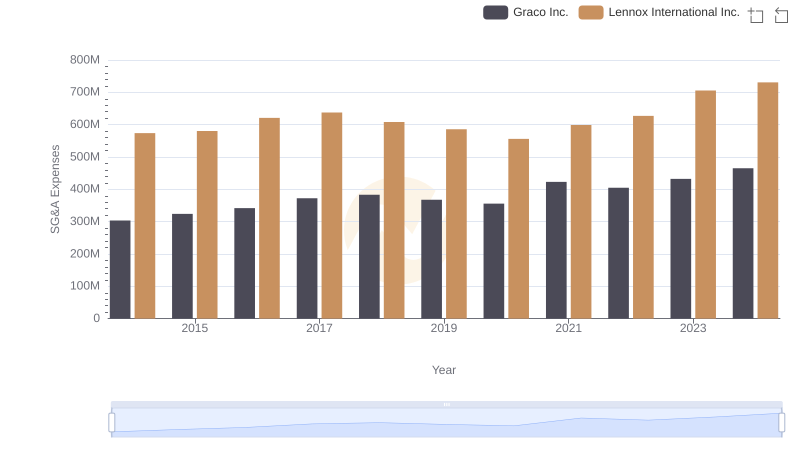
Who Optimizes SG&A Costs Better? Lennox International Inc. or Graco Inc.
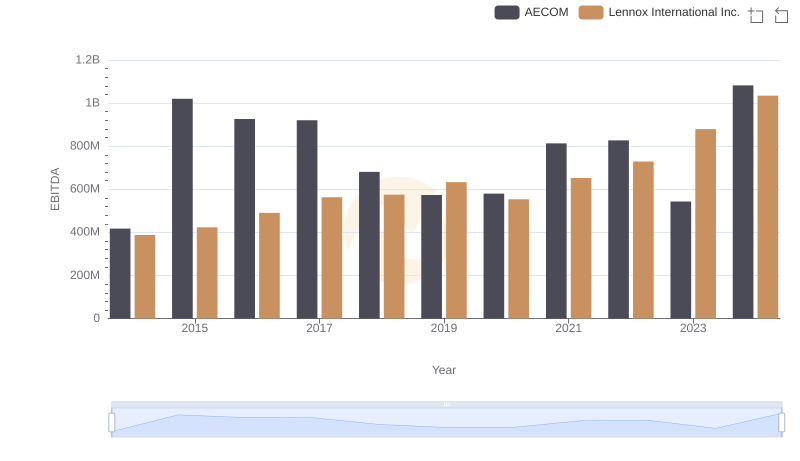
EBITDA Analysis: Evaluating Lennox International Inc. Against AECOM
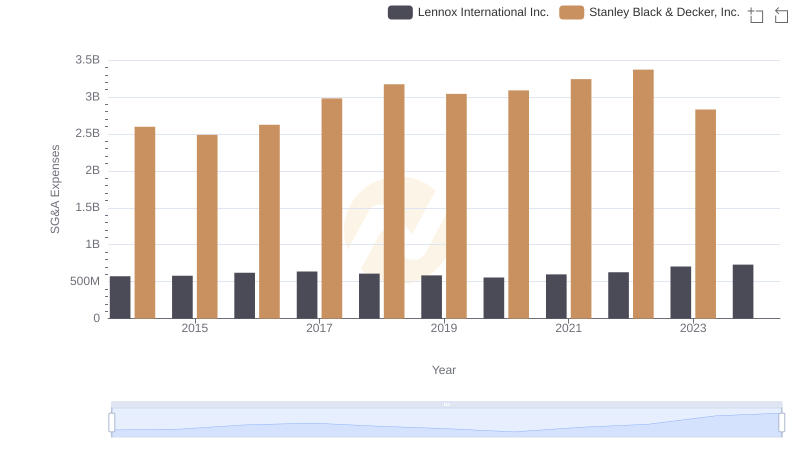
Comparing SG&A Expenses: Lennox International Inc. vs Stanley Black & Decker, Inc. Trends and Insights

Lennox International Inc. vs Saia, Inc.: SG&A Expense Trends