| __timestamp | Avery Dennison Corporation | Lennox International Inc. |
|---|---|---|
| Wednesday, January 1, 2014 | 1155300000 | 573700000 |
| Thursday, January 1, 2015 | 1108100000 | 580500000 |
| Friday, January 1, 2016 | 1097500000 | 621000000 |
| Sunday, January 1, 2017 | 1123200000 | 637700000 |
| Monday, January 1, 2018 | 1127500000 | 608200000 |
| Tuesday, January 1, 2019 | 1080400000 | 585900000 |
| Wednesday, January 1, 2020 | 1060500000 | 555900000 |
| Friday, January 1, 2021 | 1248500000 | 598900000 |
| Saturday, January 1, 2022 | 1330800000 | 627200000 |
| Sunday, January 1, 2023 | 1177900000 | 705500000 |
| Monday, January 1, 2024 | 1415300000 | 730600000 |
Infusing magic into the data realm
In the ever-evolving landscape of corporate finance, understanding operational costs is crucial. This analysis delves into the Selling, General, and Administrative (SG&A) expenses of two industry giants: Lennox International Inc. and Avery Dennison Corporation, from 2014 to 2023.
Avery Dennison's SG&A expenses have shown a steady increase, peaking in 2022 with a 15% rise from 2014. This upward trend reflects strategic investments in marketing and administration, crucial for maintaining its competitive edge.
Conversely, Lennox International's SG&A expenses have been more volatile, with a notable 23% increase in 2023 compared to 2014. This fluctuation indicates a dynamic approach to managing operational costs, possibly in response to market demands.
While both companies exhibit distinct trends, the data underscores the importance of strategic financial management in sustaining growth and competitiveness.
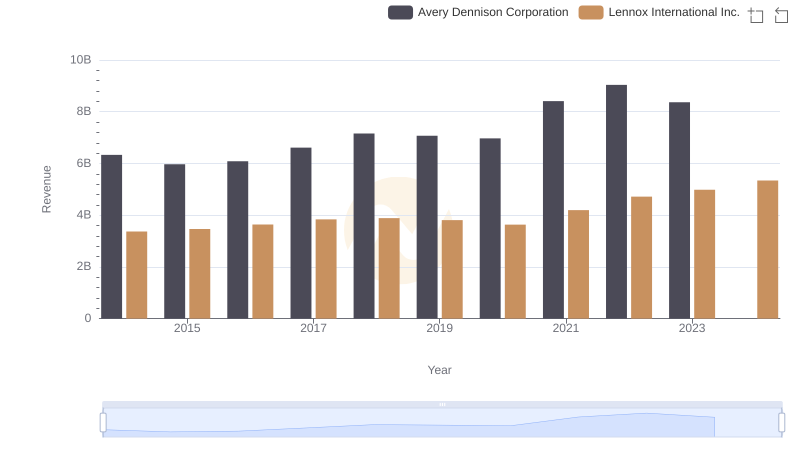
Lennox International Inc. and Avery Dennison Corporation: A Comprehensive Revenue Analysis
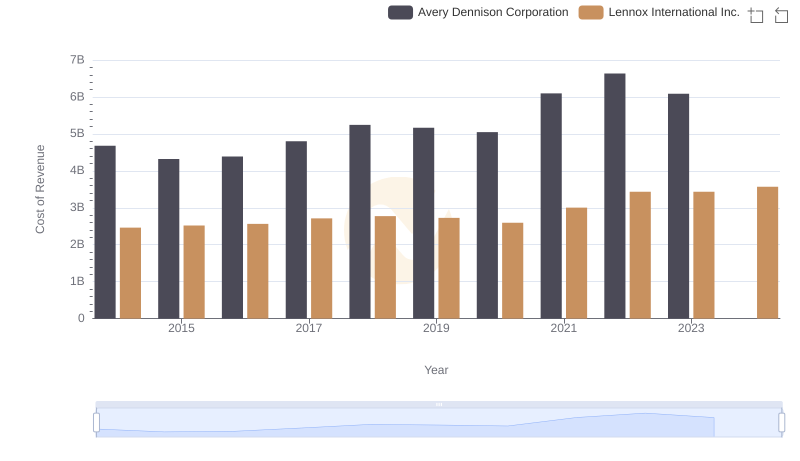
Cost of Revenue Comparison: Lennox International Inc. vs Avery Dennison Corporation
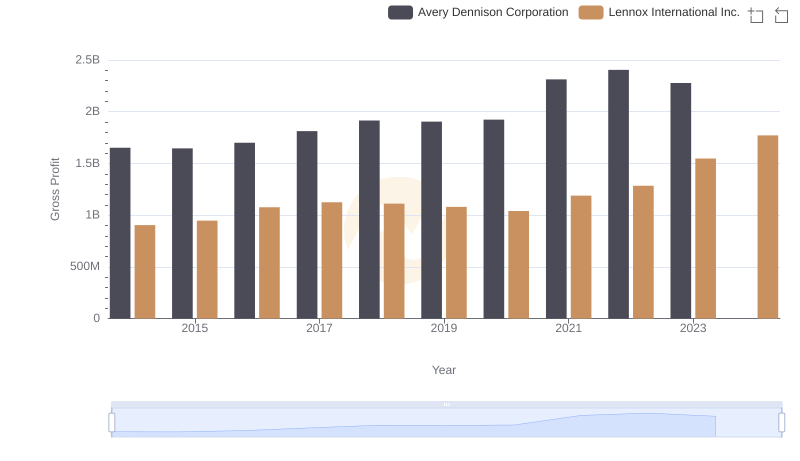
Gross Profit Analysis: Comparing Lennox International Inc. and Avery Dennison Corporation
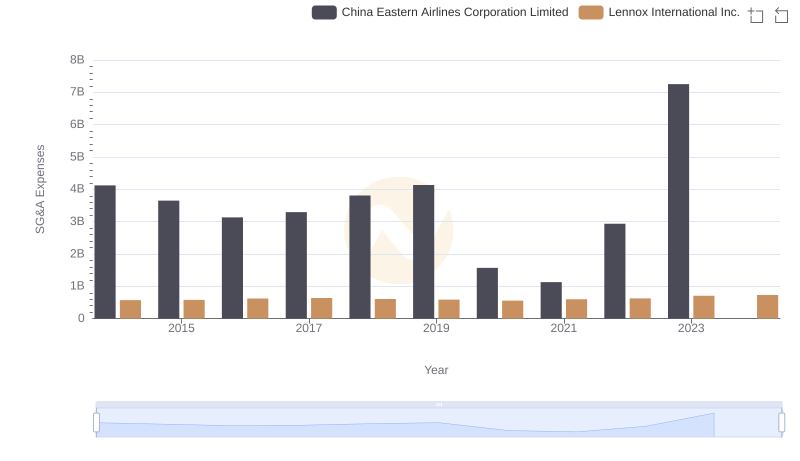
Lennox International Inc. and China Eastern Airlines Corporation Limited: SG&A Spending Patterns Compared
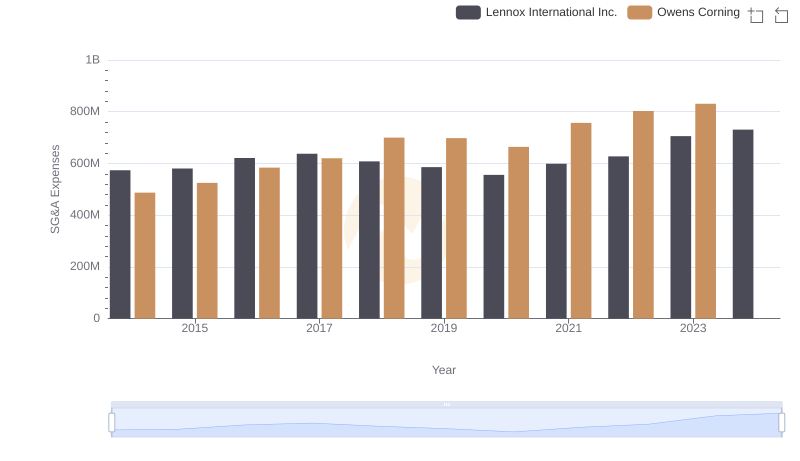
Lennox International Inc. or Owens Corning: Who Manages SG&A Costs Better?
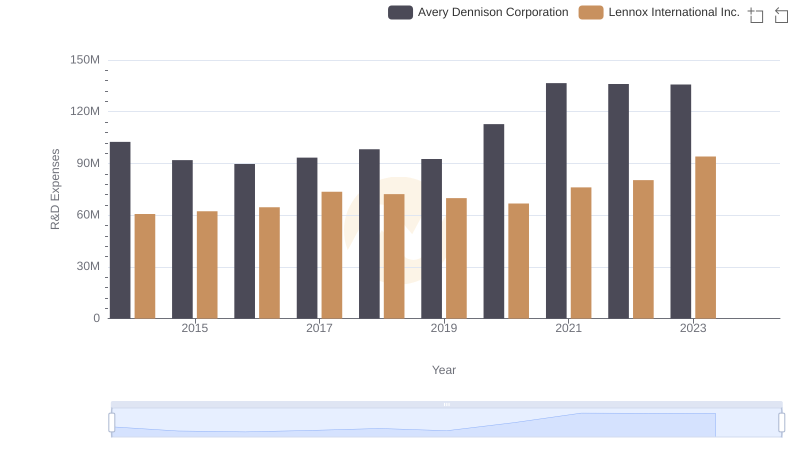
Lennox International Inc. or Avery Dennison Corporation: Who Invests More in Innovation?
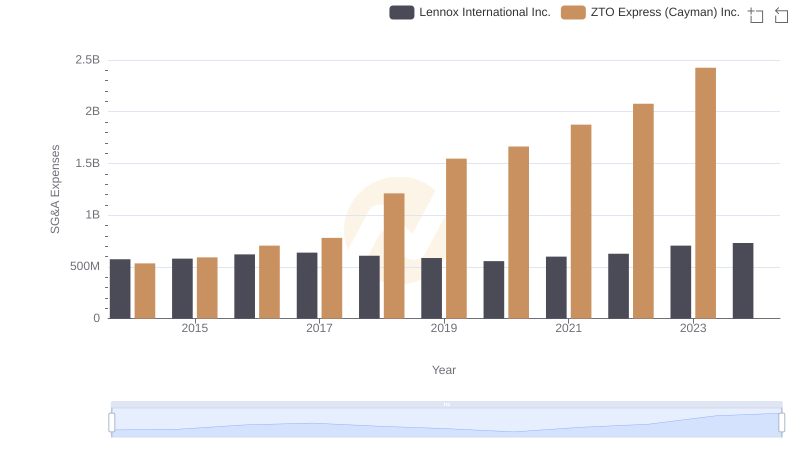
Operational Costs Compared: SG&A Analysis of Lennox International Inc. and ZTO Express (Cayman) Inc.
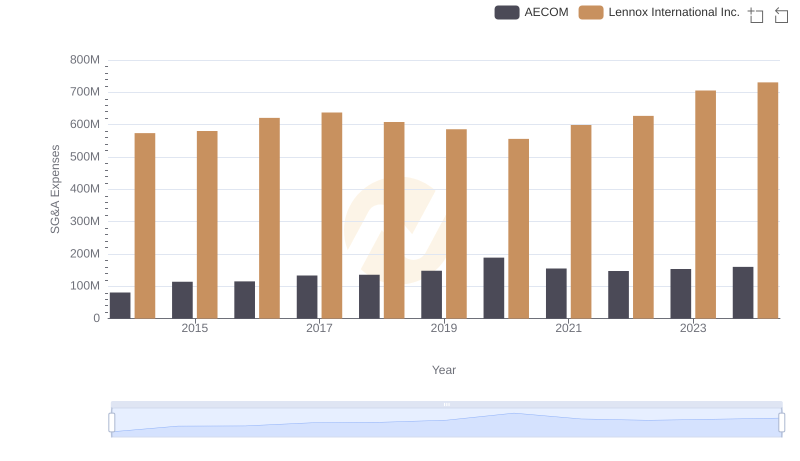
Who Optimizes SG&A Costs Better? Lennox International Inc. or AECOM
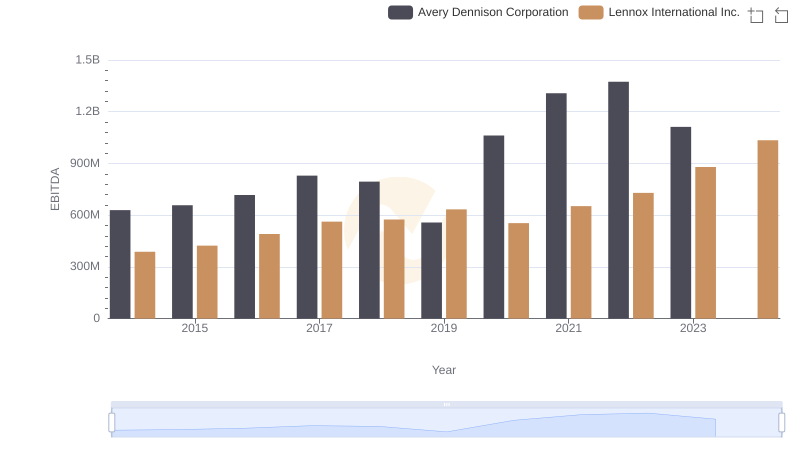
A Professional Review of EBITDA: Lennox International Inc. Compared to Avery Dennison Corporation
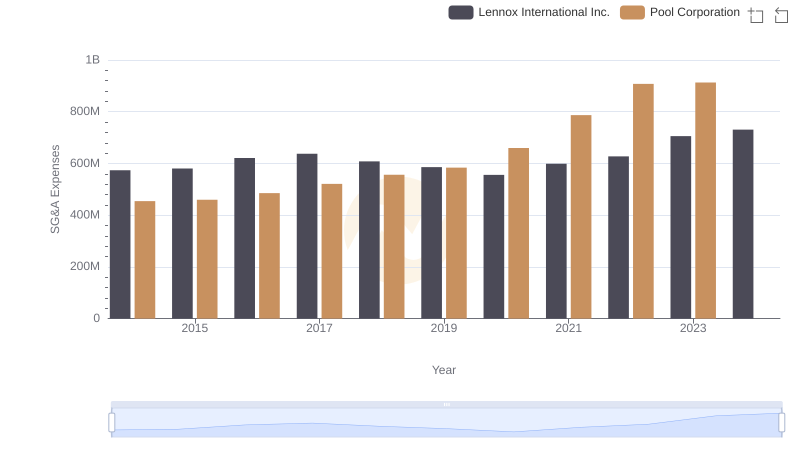
Selling, General, and Administrative Costs: Lennox International Inc. vs Pool Corporation
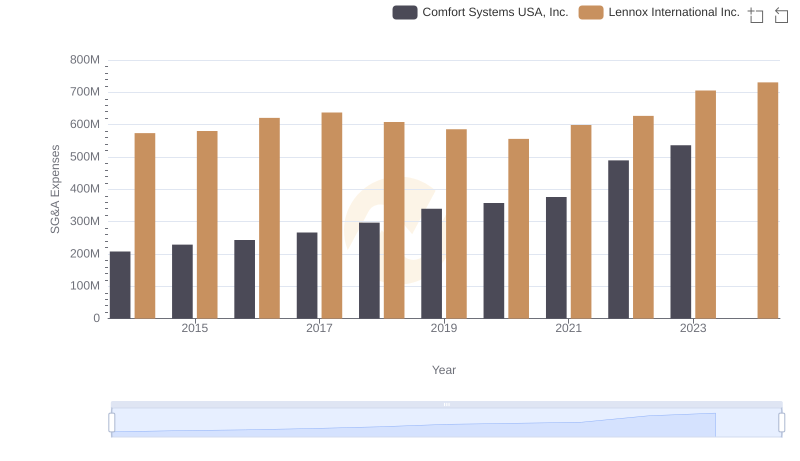
Selling, General, and Administrative Costs: Lennox International Inc. vs Comfort Systems USA, Inc.
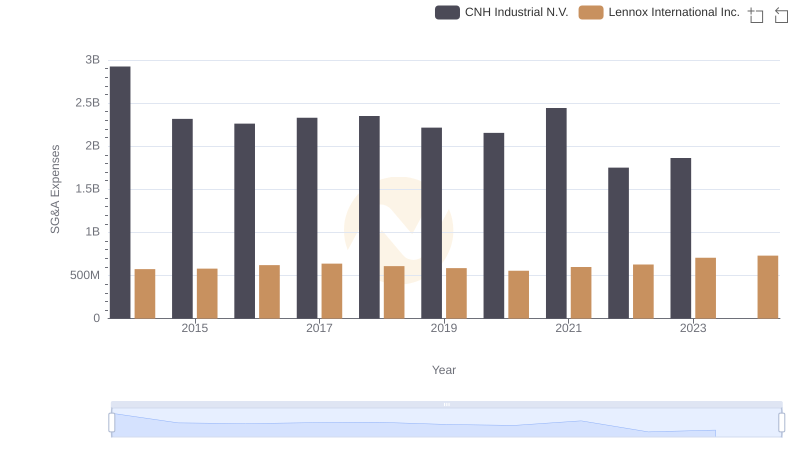
Breaking Down SG&A Expenses: Lennox International Inc. vs CNH Industrial N.V.