| __timestamp | Graco Inc. | Lennox International Inc. |
|---|---|---|
| Wednesday, January 1, 2014 | 303565000 | 573700000 |
| Thursday, January 1, 2015 | 324016000 | 580500000 |
| Friday, January 1, 2016 | 341734000 | 621000000 |
| Sunday, January 1, 2017 | 372496000 | 637700000 |
| Monday, January 1, 2018 | 382988000 | 608200000 |
| Tuesday, January 1, 2019 | 367743000 | 585900000 |
| Wednesday, January 1, 2020 | 355796000 | 555900000 |
| Friday, January 1, 2021 | 422975000 | 598900000 |
| Saturday, January 1, 2022 | 404731000 | 627200000 |
| Sunday, January 1, 2023 | 432156000 | 705500000 |
| Monday, January 1, 2024 | 465133000 | 730600000 |
Unleashing insights
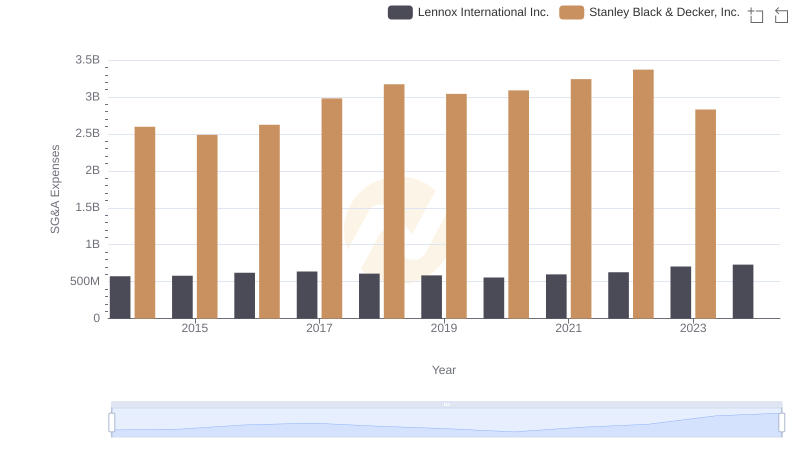
In the competitive landscape of industrial manufacturing, managing Selling, General, and Administrative (SG&A) expenses is crucial for profitability. Over the past decade, Lennox International Inc. and Graco Inc. have demonstrated contrasting strategies in optimizing these costs. From 2014 to 2024, Lennox International Inc. consistently reported higher SG&A expenses, peaking at approximately 7.3 billion in 2024. In contrast, Graco Inc. maintained a more conservative approach, with expenses rising from 3.0 billion in 2014 to 4.7 billion in 2024.
Despite Lennox's higher absolute figures, both companies show a similar upward trend in SG&A costs, with Graco's expenses increasing by about 53% and Lennox's by 27% over the decade. This data suggests that while Lennox operates on a larger scale, Graco's efficiency in managing SG&A costs could offer a competitive edge in the long run.
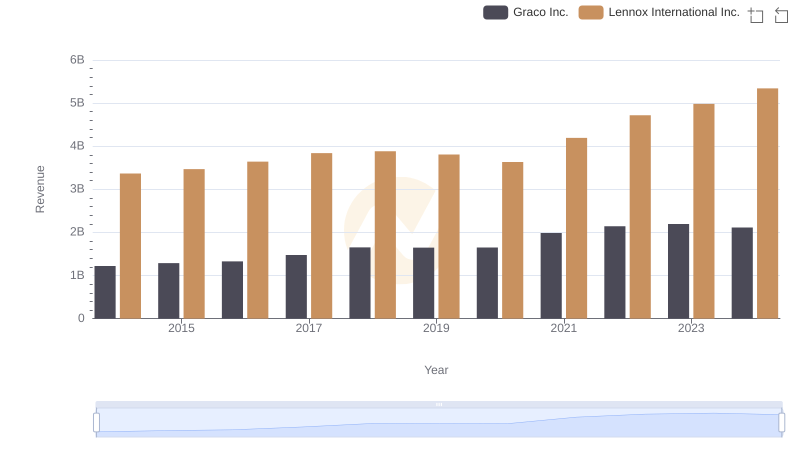
Revenue Showdown: Lennox International Inc. vs Graco Inc.
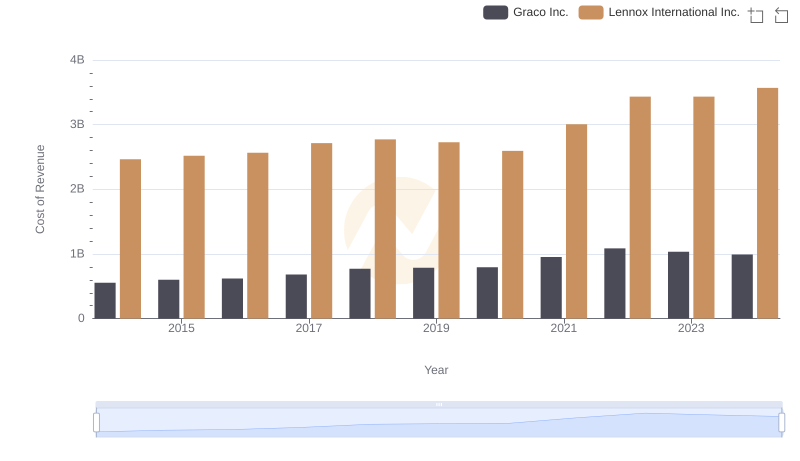
Cost of Revenue Comparison: Lennox International Inc. vs Graco Inc.
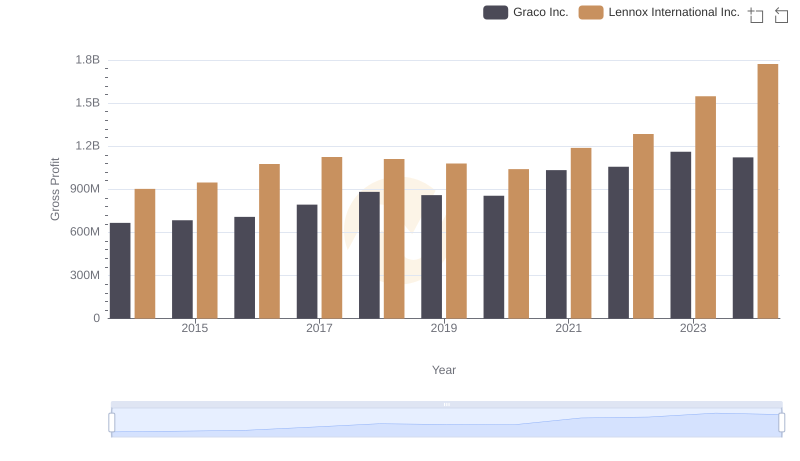
Lennox International Inc. and Graco Inc.: A Detailed Gross Profit Analysis
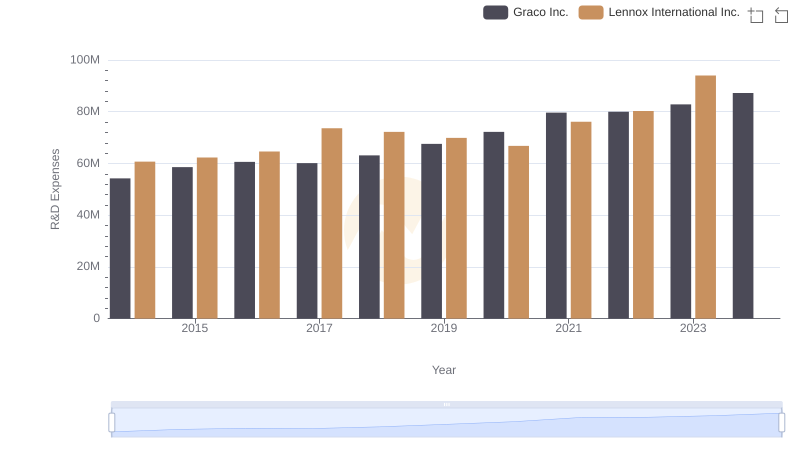
Lennox International Inc. or Graco Inc.: Who Invests More in Innovation?
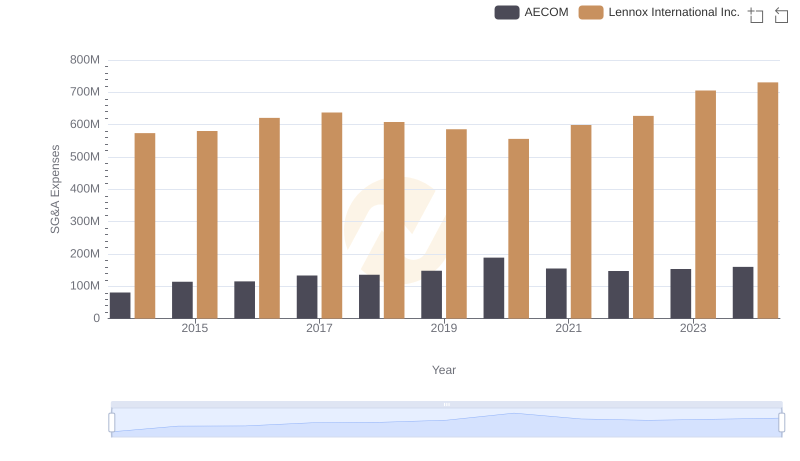
Who Optimizes SG&A Costs Better? Lennox International Inc. or AECOM
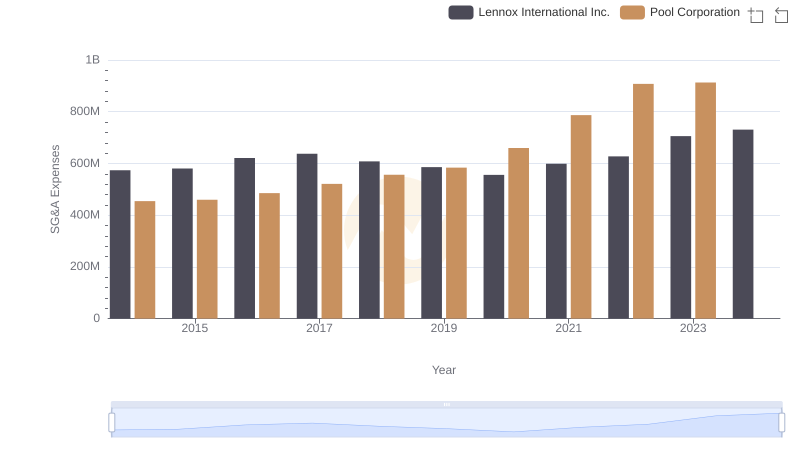
Selling, General, and Administrative Costs: Lennox International Inc. vs Pool Corporation
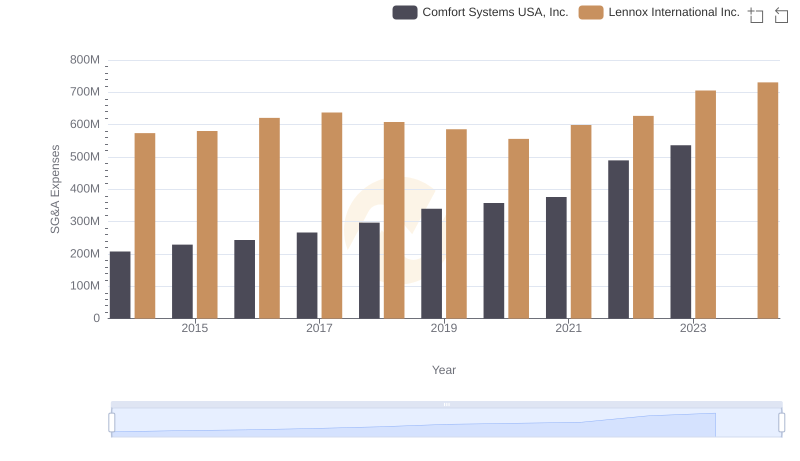
Selling, General, and Administrative Costs: Lennox International Inc. vs Comfort Systems USA, Inc.
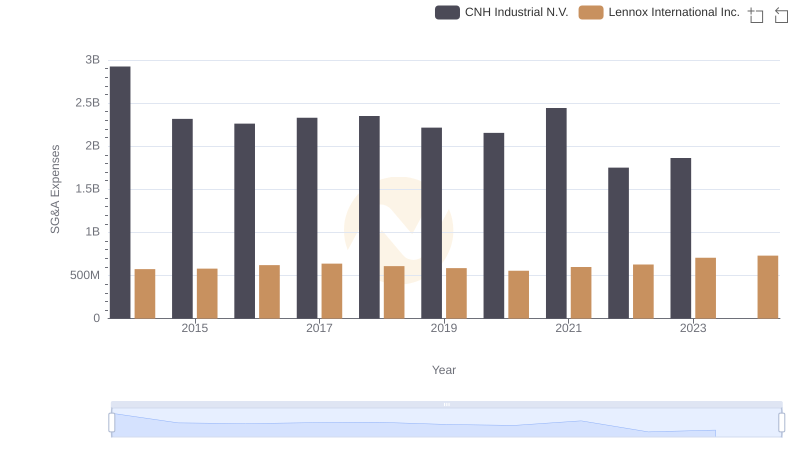
Breaking Down SG&A Expenses: Lennox International Inc. vs CNH Industrial N.V.
Comparing SG&A Expenses: Lennox International Inc. vs Stanley Black & Decker, Inc. Trends and Insights

Lennox International Inc. vs Saia, Inc.: SG&A Expense Trends
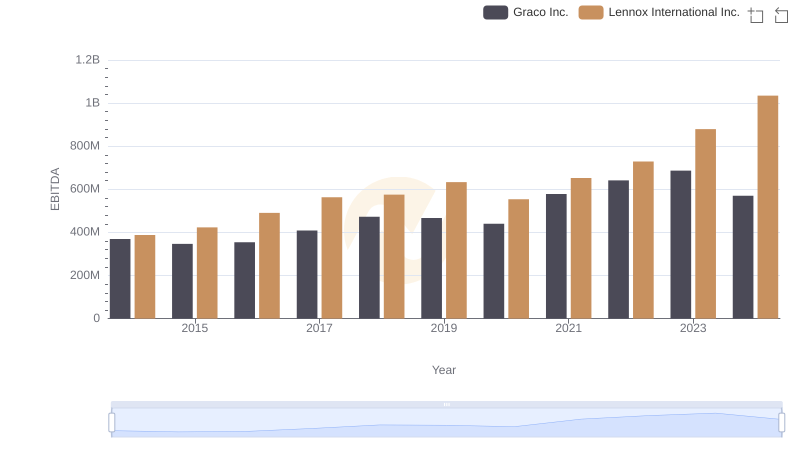
Comparative EBITDA Analysis: Lennox International Inc. vs Graco Inc.
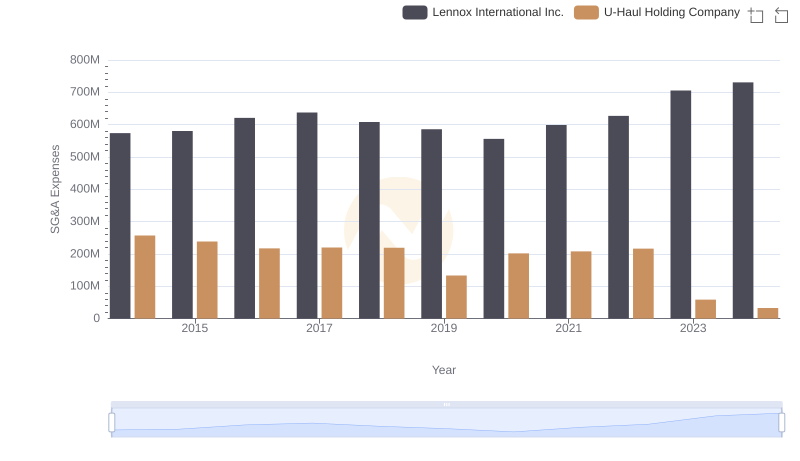
Selling, General, and Administrative Costs: Lennox International Inc. vs U-Haul Holding Company