| __timestamp | Lennox International Inc. | Stanley Black & Decker, Inc. |
|---|---|---|
| Wednesday, January 1, 2014 | 573700000 | 2595900000 |
| Thursday, January 1, 2015 | 580500000 | 2486400000 |
| Friday, January 1, 2016 | 621000000 | 2623900000 |
| Sunday, January 1, 2017 | 637700000 | 2980100000 |
| Monday, January 1, 2018 | 608200000 | 3171700000 |
| Tuesday, January 1, 2019 | 585900000 | 3041000000 |
| Wednesday, January 1, 2020 | 555900000 | 3089600000 |
| Friday, January 1, 2021 | 598900000 | 3240400000 |
| Saturday, January 1, 2022 | 627200000 | 3370000000 |
| Sunday, January 1, 2023 | 705500000 | 2829300000 |
| Monday, January 1, 2024 | 730600000 | 3310500000 |
Cracking the code
In the competitive landscape of industrial manufacturing, understanding the financial strategies of leading companies is crucial. Lennox International Inc. and Stanley Black & Decker, Inc. have been pivotal players, each with distinct approaches to managing Selling, General, and Administrative (SG&A) expenses.
From 2014 to 2023, Lennox International Inc. saw a steady increase in SG&A expenses, peaking at approximately 730 million in 2023, a 27% rise from 2014. In contrast, Stanley Black & Decker, Inc. experienced fluctuations, with a notable peak in 2022 at 3.37 billion, before a decline in 2023.
Lennox's consistent growth in SG&A expenses suggests a strategic investment in operational efficiency and market expansion. Meanwhile, Stanley Black & Decker's variable trend may reflect adaptive strategies in response to market dynamics. These insights offer a window into the financial health and strategic priorities of these industry leaders.

Lennox International Inc. vs Stanley Black & Decker, Inc.: Annual Revenue Growth Compared
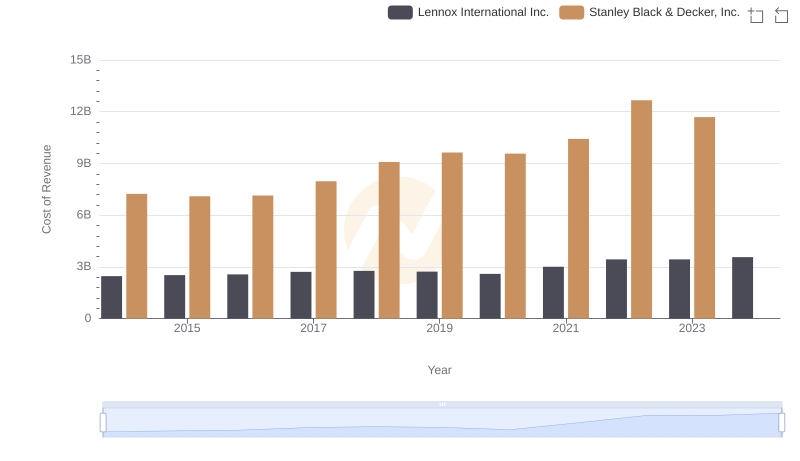
Lennox International Inc. vs Stanley Black & Decker, Inc.: Efficiency in Cost of Revenue Explored

Key Insights on Gross Profit: Lennox International Inc. vs Stanley Black & Decker, Inc.
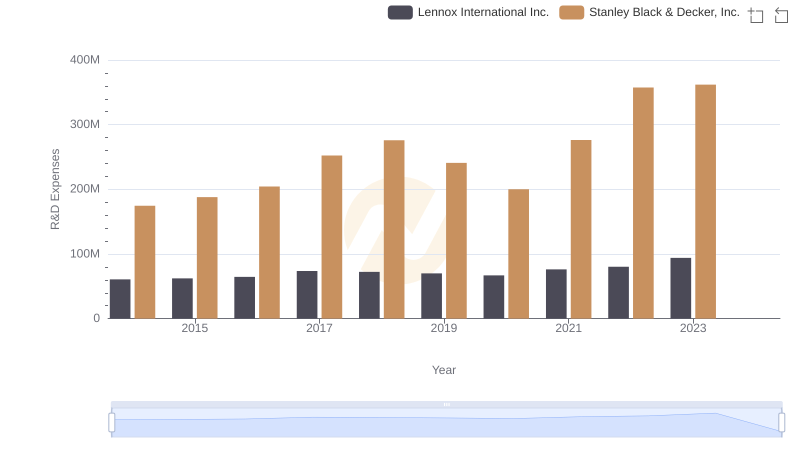
Research and Development Expenses Breakdown: Lennox International Inc. vs Stanley Black & Decker, Inc.
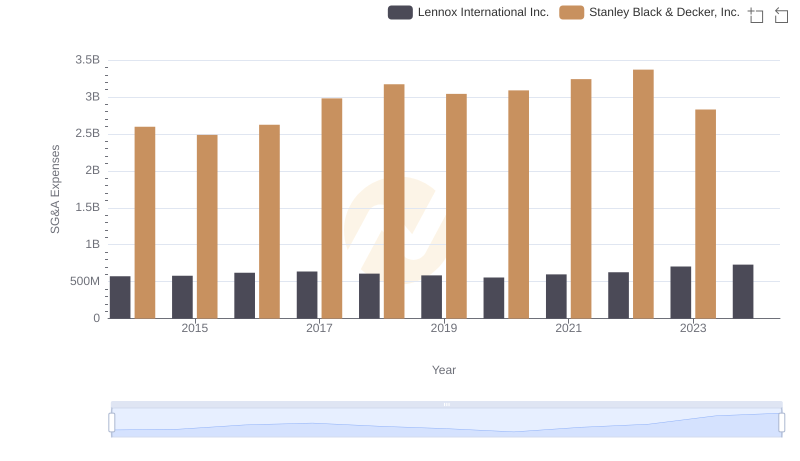
Who Optimizes SG&A Costs Better? Lennox International Inc. or Stanley Black & Decker, Inc.

A Professional Review of EBITDA: Lennox International Inc. Compared to Stanley Black & Decker, Inc.
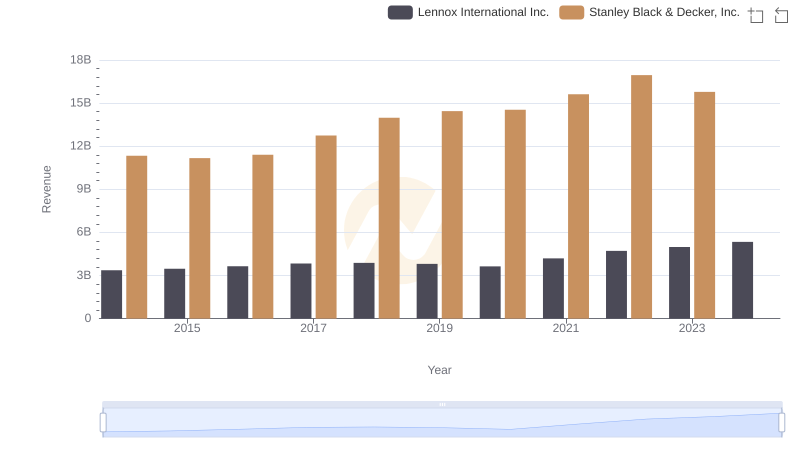
Lennox International Inc. and Stanley Black & Decker, Inc.: A Comprehensive Revenue Analysis

Analyzing Cost of Revenue: Lennox International Inc. and Stanley Black & Decker, Inc.
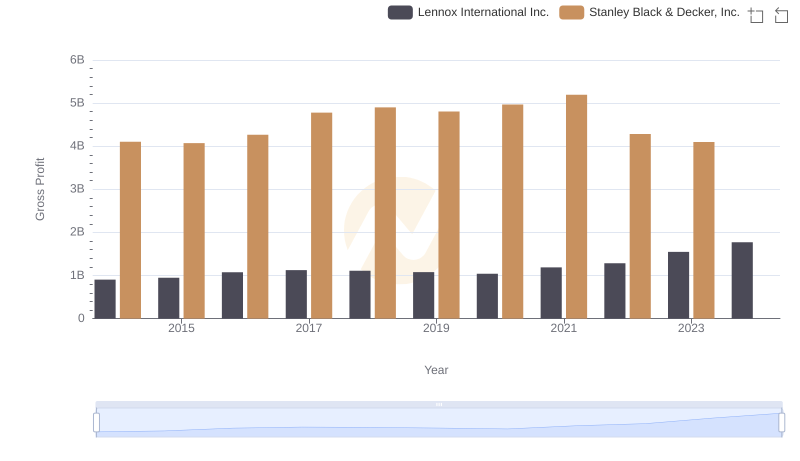
Lennox International Inc. vs Stanley Black & Decker, Inc.: A Gross Profit Performance Breakdown

Research and Development: Comparing Key Metrics for Lennox International Inc. and Stanley Black & Decker, Inc.

Lennox International Inc. vs Saia, Inc.: SG&A Expense Trends

Professional EBITDA Benchmarking: Lennox International Inc. vs Stanley Black & Decker, Inc.