| __timestamp | AECOM | Lennox International Inc. |
|---|---|---|
| Wednesday, January 1, 2014 | 4855627000 | 3367400000 |
| Thursday, January 1, 2015 | 17989880000 | 3467400000 |
| Friday, January 1, 2016 | 17410825000 | 3641600000 |
| Sunday, January 1, 2017 | 18203402000 | 3839600000 |
| Monday, January 1, 2018 | 20155512000 | 3883900000 |
| Tuesday, January 1, 2019 | 20173329000 | 3807200000 |
| Wednesday, January 1, 2020 | 13239976000 | 3634100000 |
| Friday, January 1, 2021 | 13340852000 | 4194100000 |
| Saturday, January 1, 2022 | 13148182000 | 4718400000 |
| Sunday, January 1, 2023 | 14378461000 | 4981900000 |
| Monday, January 1, 2024 | 16105498000 | 5341300000 |
Cracking the code
In the ever-evolving landscape of industrial giants, Lennox International Inc. and AECOM stand as titans in their respective fields. Over the past decade, AECOM has consistently outpaced Lennox in revenue, boasting a staggering 300% higher average annual revenue. However, Lennox has shown remarkable growth, with its revenue increasing by approximately 59% from 2014 to 2024.
From 2014 to 2024, AECOM's revenue peaked in 2018, reaching nearly $20 billion, before experiencing a dip in 2020. In contrast, Lennox's revenue has steadily climbed, culminating in a 2024 figure of over $5 billion. This growth trajectory highlights Lennox's resilience and strategic market positioning.
As we look to the future, both companies are poised for continued success, with AECOM's diversified portfolio and Lennox's innovative solutions driving their respective growth strategies.
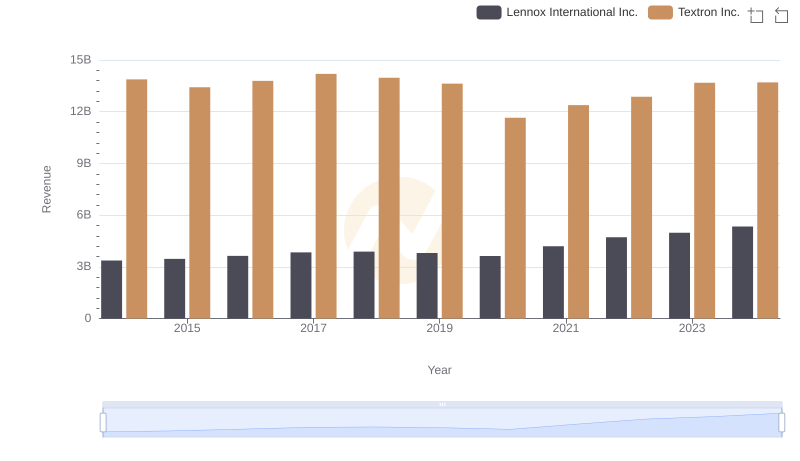
Lennox International Inc. vs Textron Inc.: Annual Revenue Growth Compared
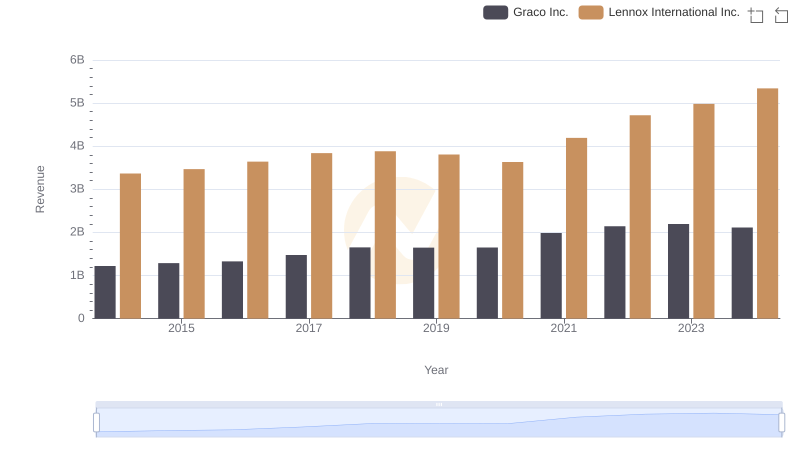
Revenue Showdown: Lennox International Inc. vs Graco Inc.
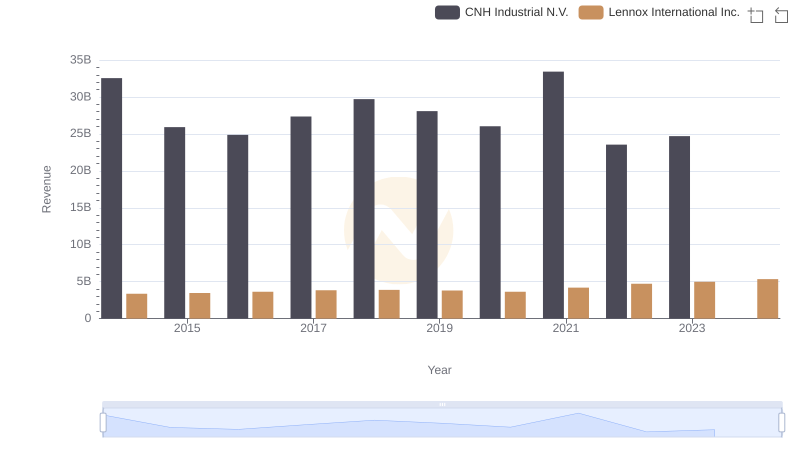
Lennox International Inc. and CNH Industrial N.V.: A Comprehensive Revenue Analysis
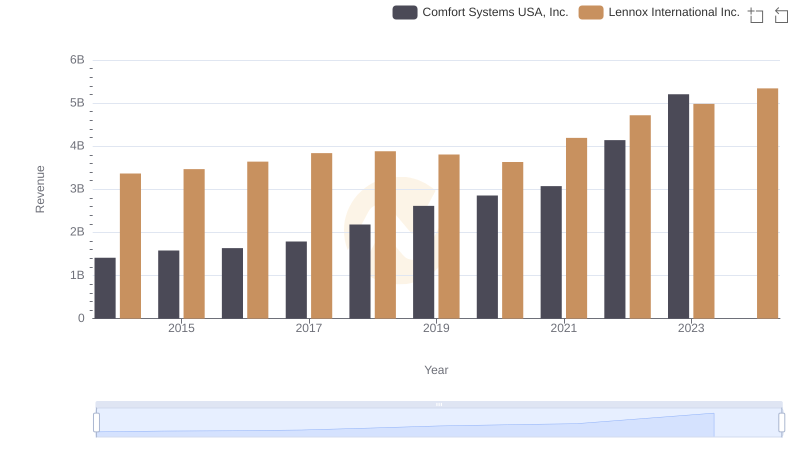
Lennox International Inc. vs Comfort Systems USA, Inc.: Annual Revenue Growth Compared
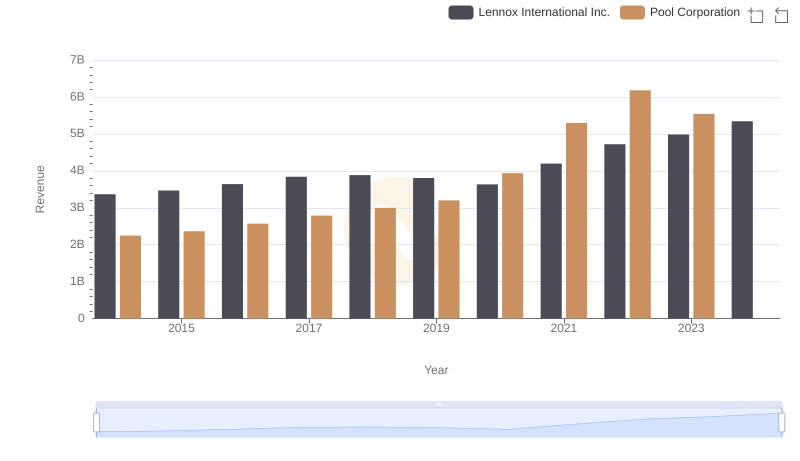
Lennox International Inc. vs Pool Corporation: Annual Revenue Growth Compared
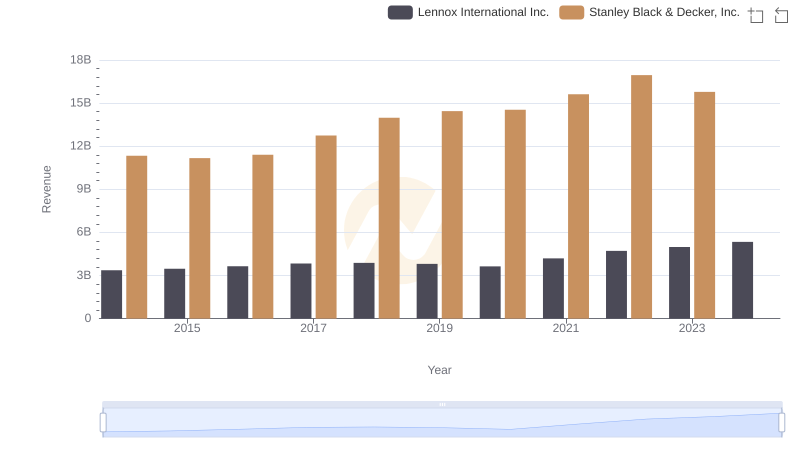
Lennox International Inc. and Stanley Black & Decker, Inc.: A Comprehensive Revenue Analysis
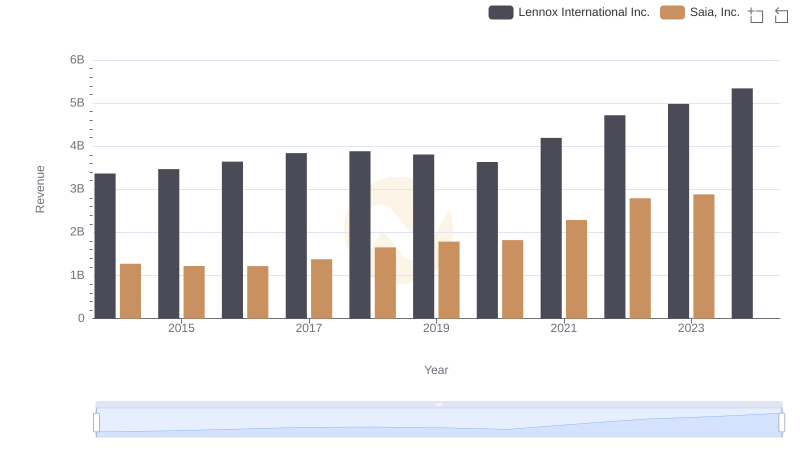
Revenue Insights: Lennox International Inc. and Saia, Inc. Performance Compared
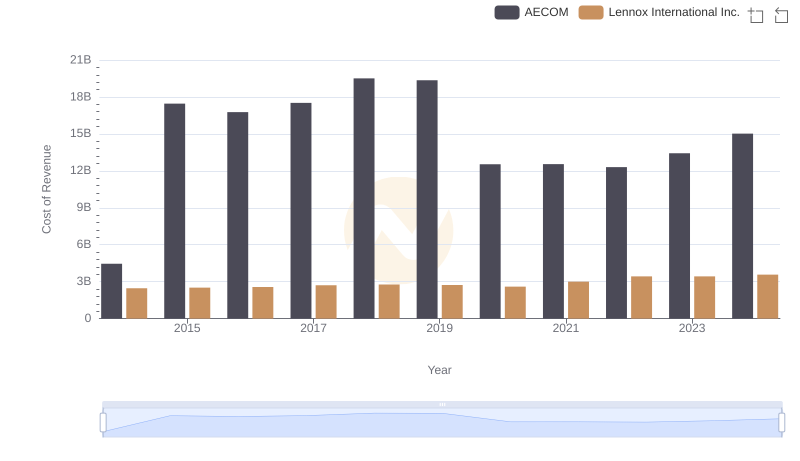
Cost of Revenue Trends: Lennox International Inc. vs AECOM
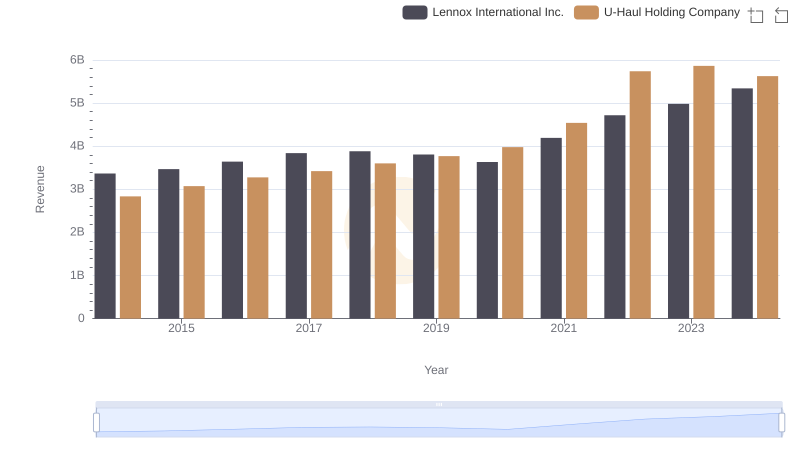
Lennox International Inc. and U-Haul Holding Company: A Comprehensive Revenue Analysis
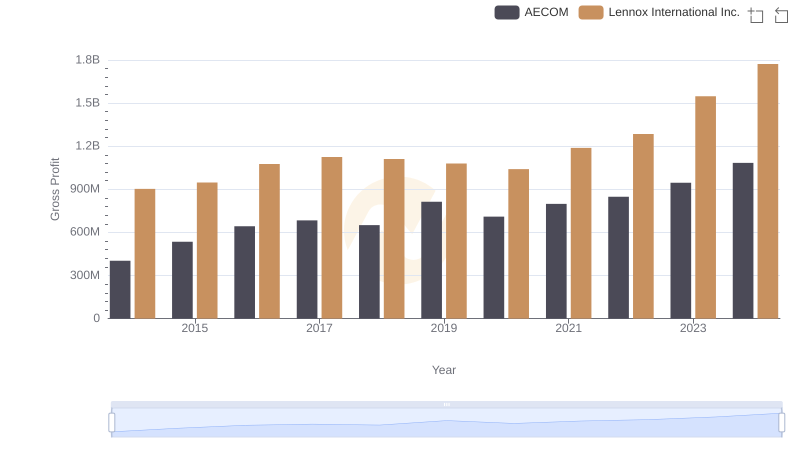
Lennox International Inc. vs AECOM: A Gross Profit Performance Breakdown
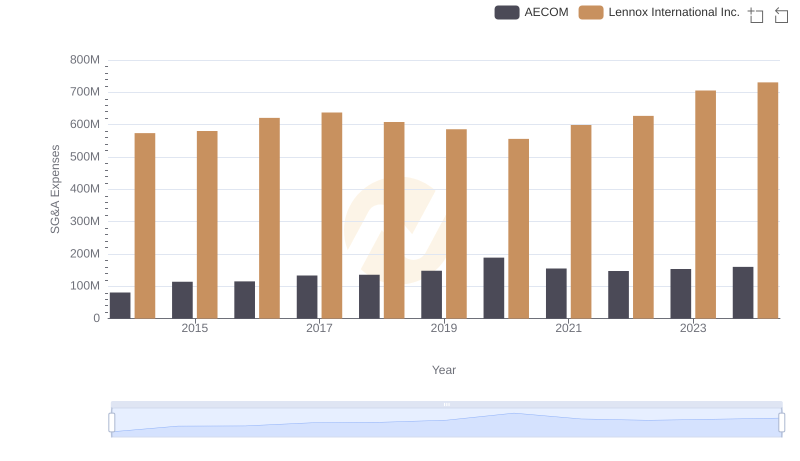
Who Optimizes SG&A Costs Better? Lennox International Inc. or AECOM
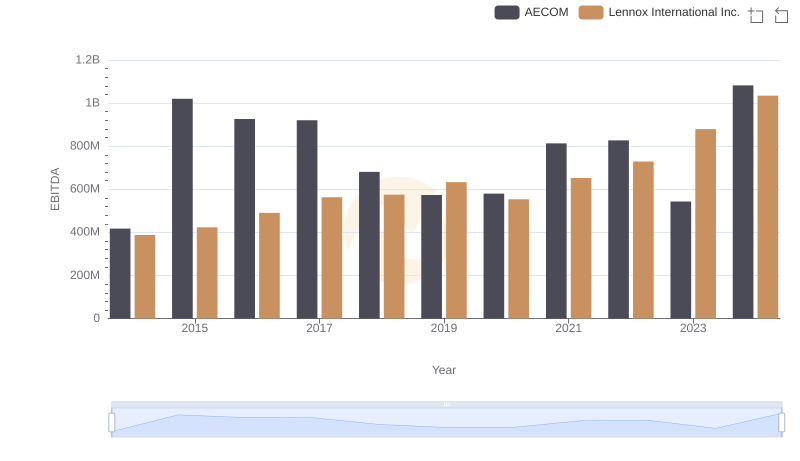
EBITDA Analysis: Evaluating Lennox International Inc. Against AECOM