| __timestamp | AECOM | Lennox International Inc. |
|---|---|---|
| Wednesday, January 1, 2014 | 417662000 | 387700000 |
| Thursday, January 1, 2015 | 1020478000 | 423600000 |
| Friday, January 1, 2016 | 926466000 | 490800000 |
| Sunday, January 1, 2017 | 920292000 | 562900000 |
| Monday, January 1, 2018 | 680801000 | 575200000 |
| Tuesday, January 1, 2019 | 573352000 | 633300000 |
| Wednesday, January 1, 2020 | 580017000 | 553900000 |
| Friday, January 1, 2021 | 813356000 | 652500000 |
| Saturday, January 1, 2022 | 826856000 | 729000000 |
| Sunday, January 1, 2023 | 543642000 | 879500000 |
| Monday, January 1, 2024 | 1082384000 | 1034800000 |
Unleashing insights
In the competitive landscape of the industrial sector, understanding EBITDA trends provides crucial insights into a company's operational efficiency. Over the past decade, AECOM and Lennox International Inc. have showcased intriguing financial trajectories. From 2014 to 2024, AECOM's EBITDA has seen a remarkable growth of approximately 159%, peaking in 2024. Meanwhile, Lennox International Inc. has demonstrated a steady increase, with a notable 167% rise over the same period, reaching its highest point in 2024.
These trends highlight the dynamic nature of the industrial sector and the importance of strategic financial management.
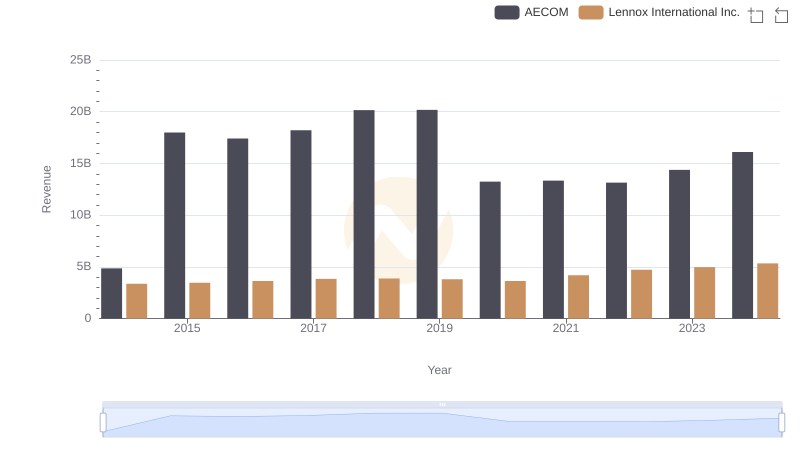
Lennox International Inc. vs AECOM: Examining Key Revenue Metrics
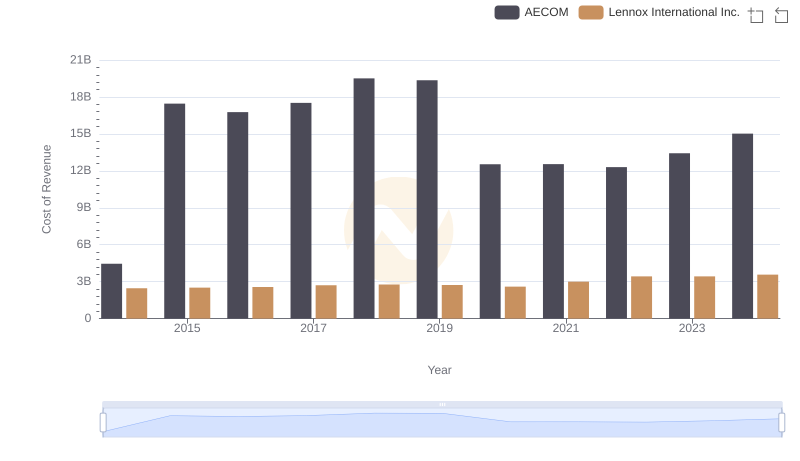
Cost of Revenue Trends: Lennox International Inc. vs AECOM
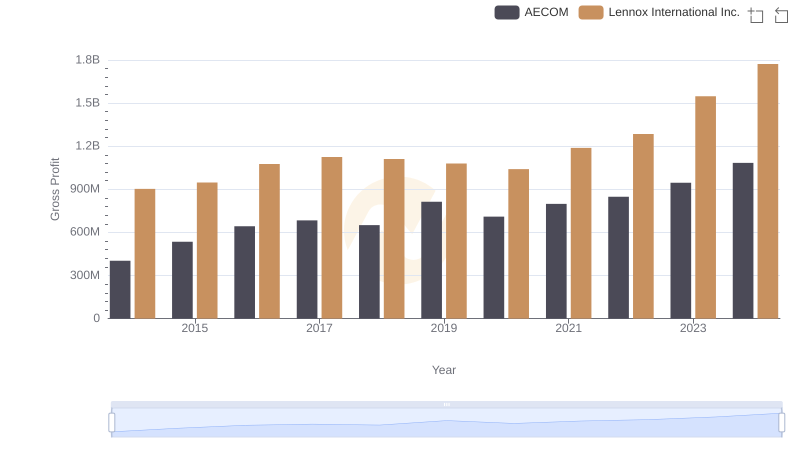
Lennox International Inc. vs AECOM: A Gross Profit Performance Breakdown
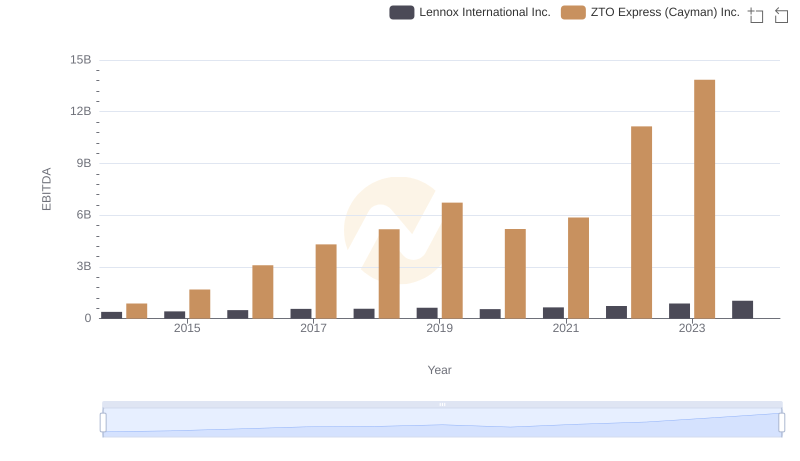
A Professional Review of EBITDA: Lennox International Inc. Compared to ZTO Express (Cayman) Inc.
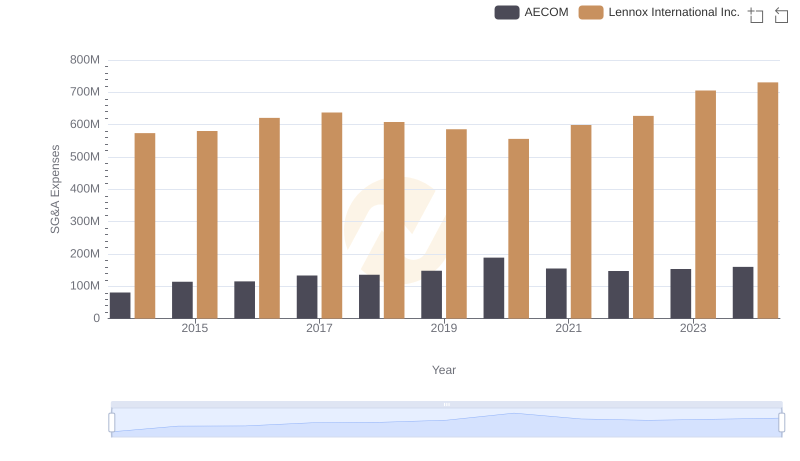
Who Optimizes SG&A Costs Better? Lennox International Inc. or AECOM
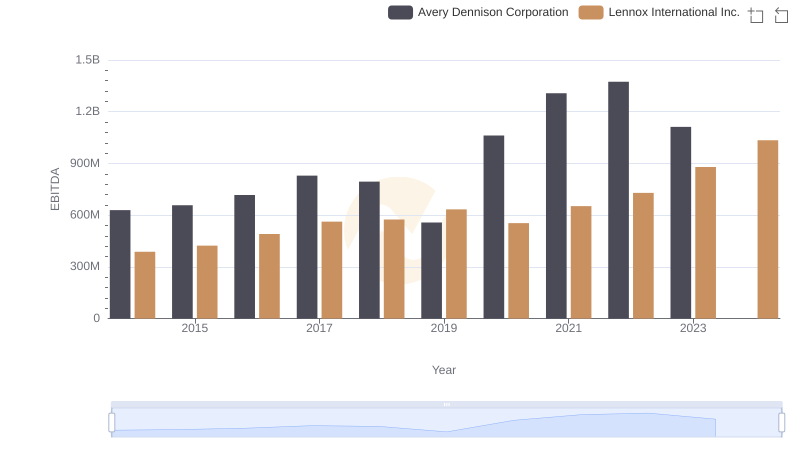
A Professional Review of EBITDA: Lennox International Inc. Compared to Avery Dennison Corporation
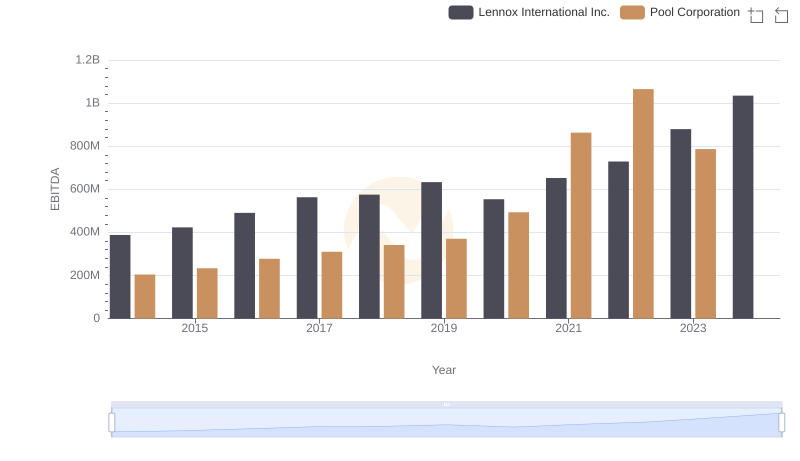
EBITDA Analysis: Evaluating Lennox International Inc. Against Pool Corporation
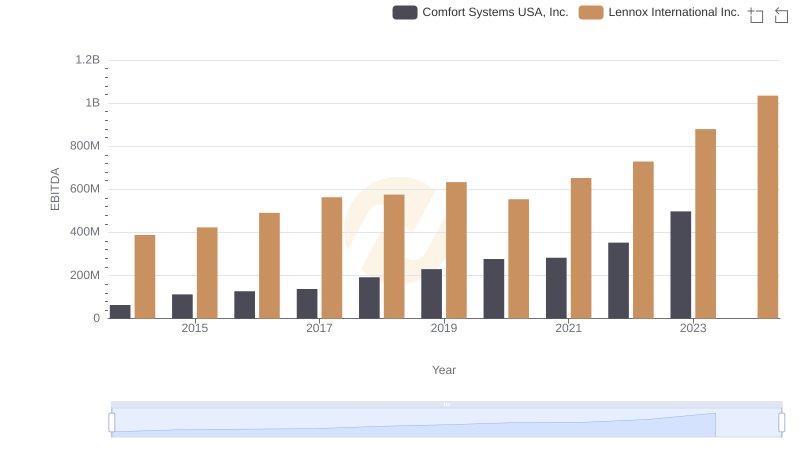
A Professional Review of EBITDA: Lennox International Inc. Compared to Comfort Systems USA, Inc.
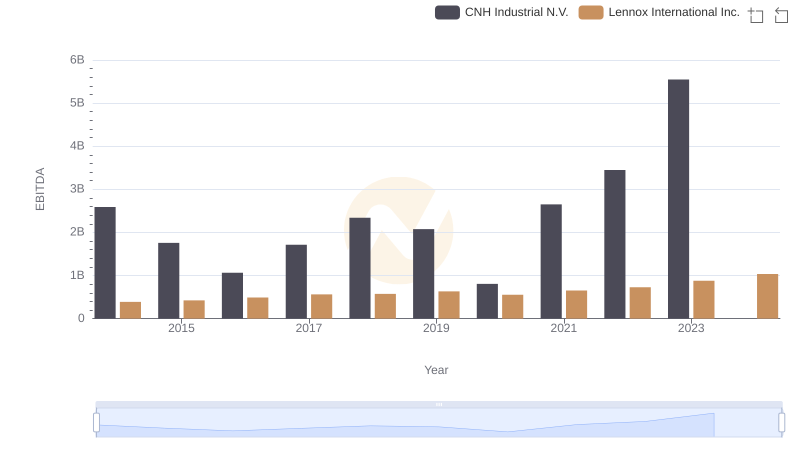
Comprehensive EBITDA Comparison: Lennox International Inc. vs CNH Industrial N.V.
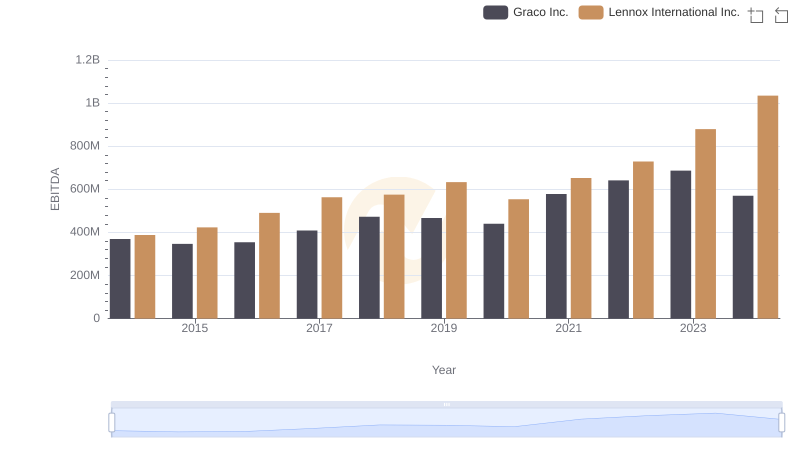
Comparative EBITDA Analysis: Lennox International Inc. vs Graco Inc.

Professional EBITDA Benchmarking: Lennox International Inc. vs Stanley Black & Decker, Inc.
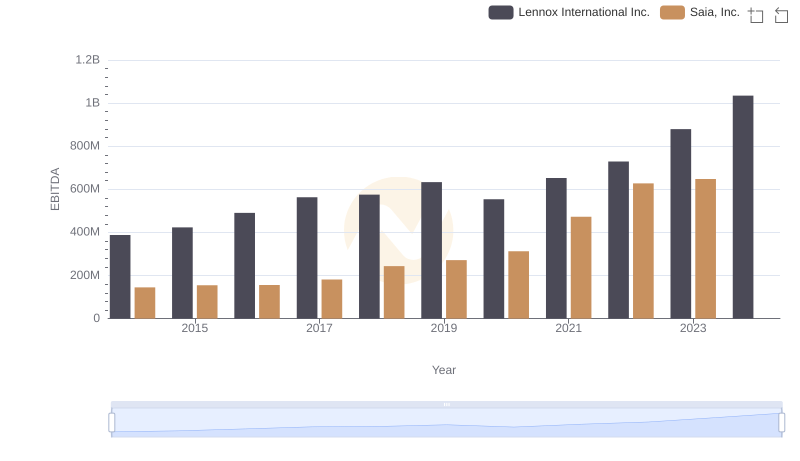
Comprehensive EBITDA Comparison: Lennox International Inc. vs Saia, Inc.