| __timestamp | Lennox International Inc. | Saia, Inc. |
|---|---|---|
| Wednesday, January 1, 2014 | 573700000 | 37563000 |
| Thursday, January 1, 2015 | 580500000 | 26832000 |
| Friday, January 1, 2016 | 621000000 | 39625000 |
| Sunday, January 1, 2017 | 637700000 | 37162000 |
| Monday, January 1, 2018 | 608200000 | 38425000 |
| Tuesday, January 1, 2019 | 585900000 | 43073000 |
| Wednesday, January 1, 2020 | 555900000 | 49761000 |
| Friday, January 1, 2021 | 598900000 | 61345000 |
| Saturday, January 1, 2022 | 627200000 | 56601000 |
| Sunday, January 1, 2023 | 705500000 | 67984000 |
| Monday, January 1, 2024 | 730600000 |
Unlocking the unknown
In the competitive landscape of corporate America, understanding the financial health of companies is crucial. This analysis delves into the Selling, General, and Administrative (SG&A) expenses of Lennox International Inc. and Saia, Inc. from 2014 to 2023. Lennox International, a leader in climate control solutions, has seen its SG&A expenses grow by approximately 27% over the decade, peaking in 2023. In contrast, Saia, Inc., a prominent player in the transportation sector, experienced a more volatile trend, with a notable 153% increase from 2015 to 2023. The data reveals a consistent upward trajectory for both companies, highlighting their strategic investments in operational efficiency and market expansion. However, the absence of 2024 data for Saia, Inc. suggests a need for further analysis to understand future trends. This financial insight underscores the dynamic nature of corporate expenses in evolving industries.
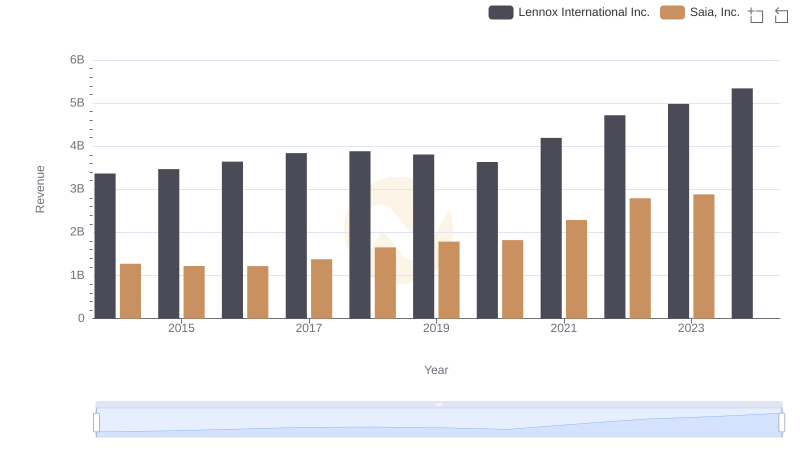
Revenue Insights: Lennox International Inc. and Saia, Inc. Performance Compared
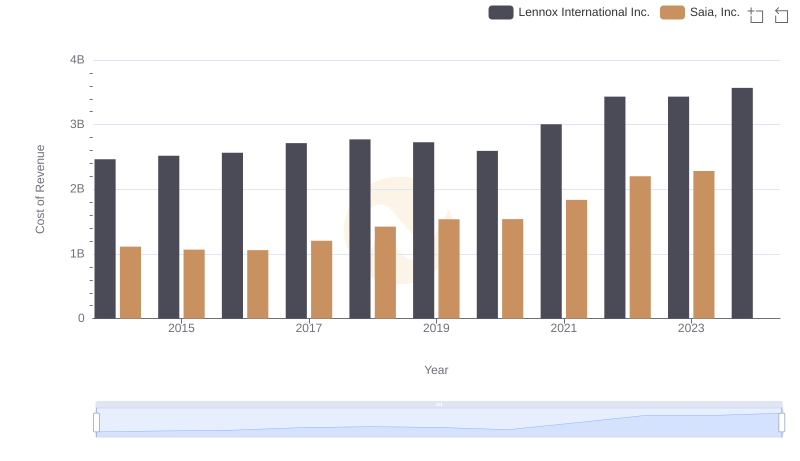
Cost Insights: Breaking Down Lennox International Inc. and Saia, Inc.'s Expenses
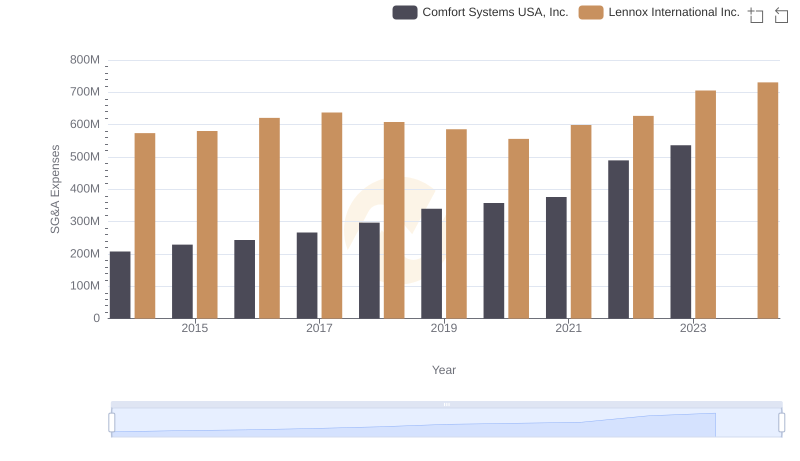
Selling, General, and Administrative Costs: Lennox International Inc. vs Comfort Systems USA, Inc.
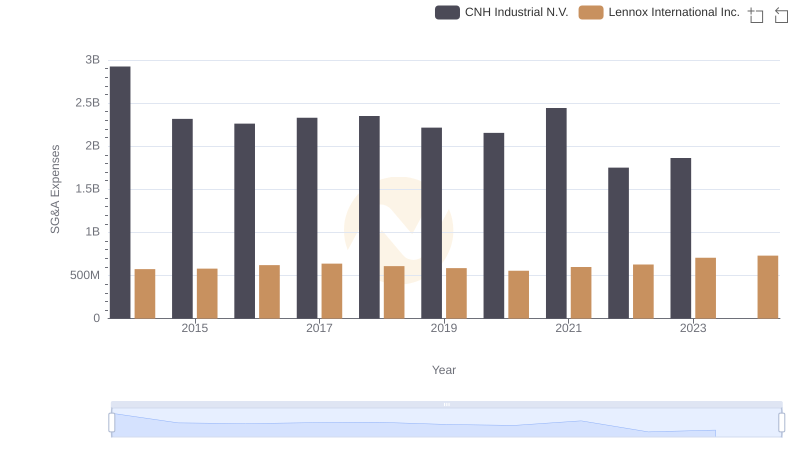
Breaking Down SG&A Expenses: Lennox International Inc. vs CNH Industrial N.V.
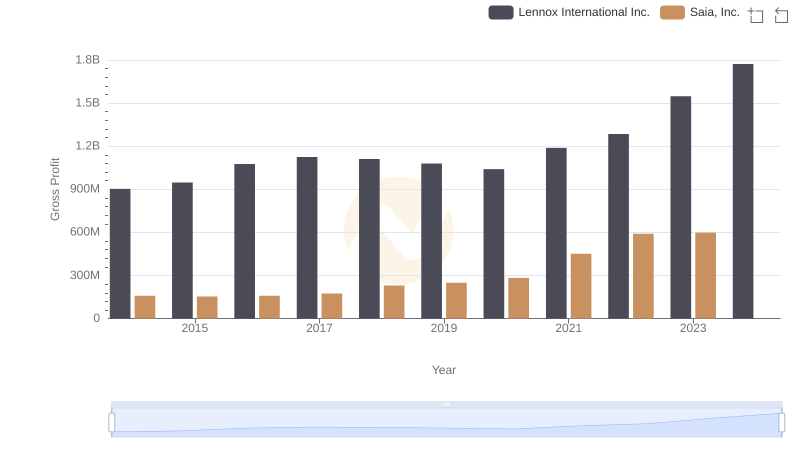
Gross Profit Trends Compared: Lennox International Inc. vs Saia, Inc.
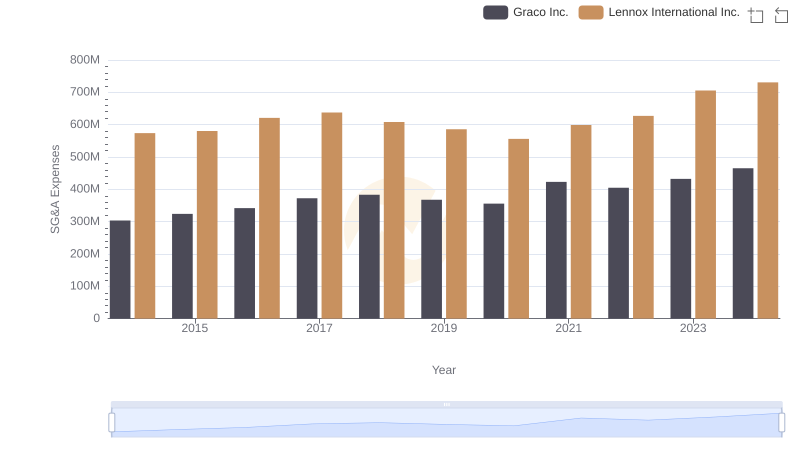
Who Optimizes SG&A Costs Better? Lennox International Inc. or Graco Inc.
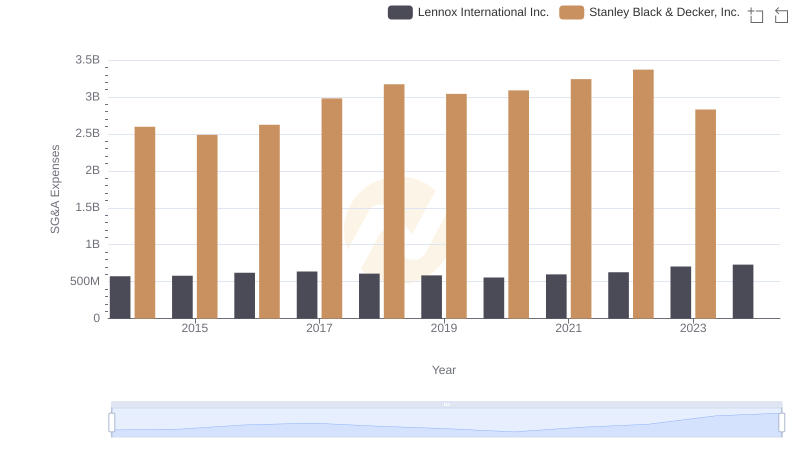
Comparing SG&A Expenses: Lennox International Inc. vs Stanley Black & Decker, Inc. Trends and Insights
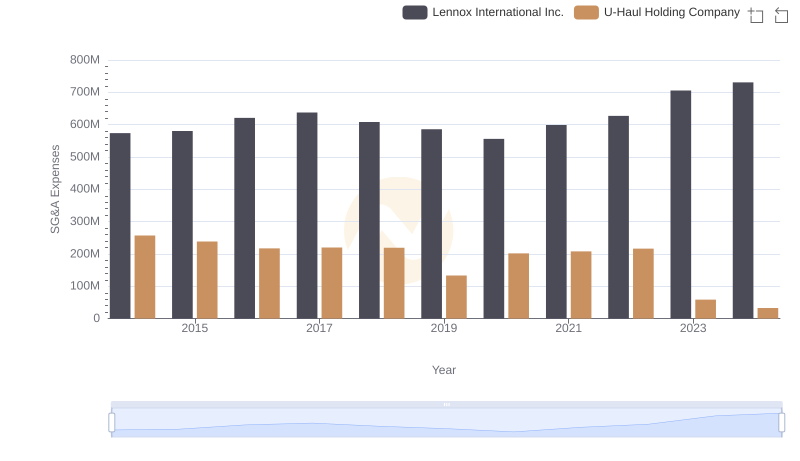
Selling, General, and Administrative Costs: Lennox International Inc. vs U-Haul Holding Company
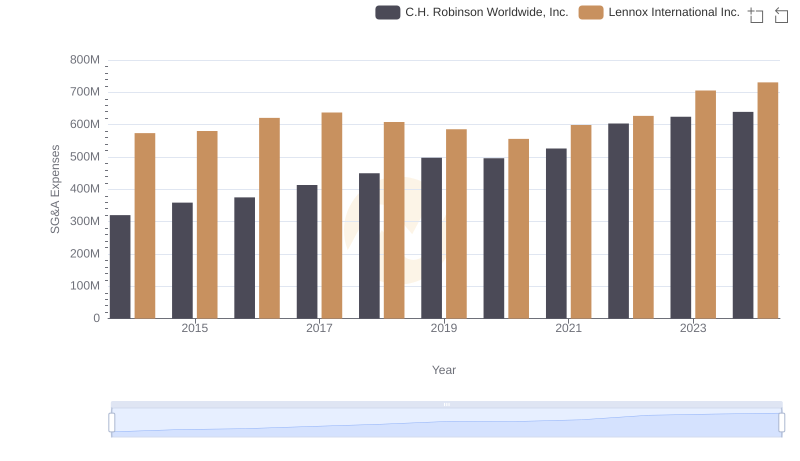
Comparing SG&A Expenses: Lennox International Inc. vs C.H. Robinson Worldwide, Inc. Trends and Insights
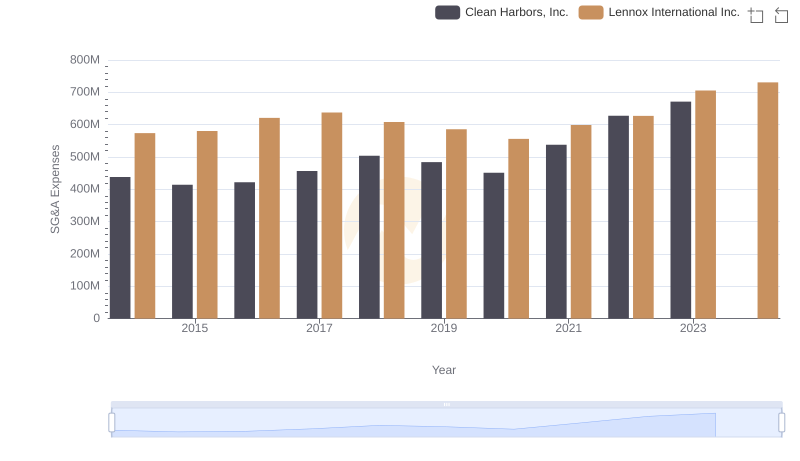
Lennox International Inc. and Clean Harbors, Inc.: SG&A Spending Patterns Compared
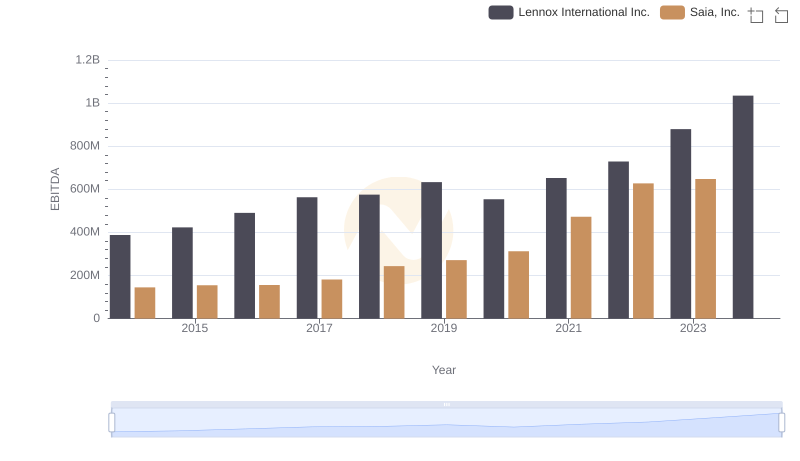
Comprehensive EBITDA Comparison: Lennox International Inc. vs Saia, Inc.
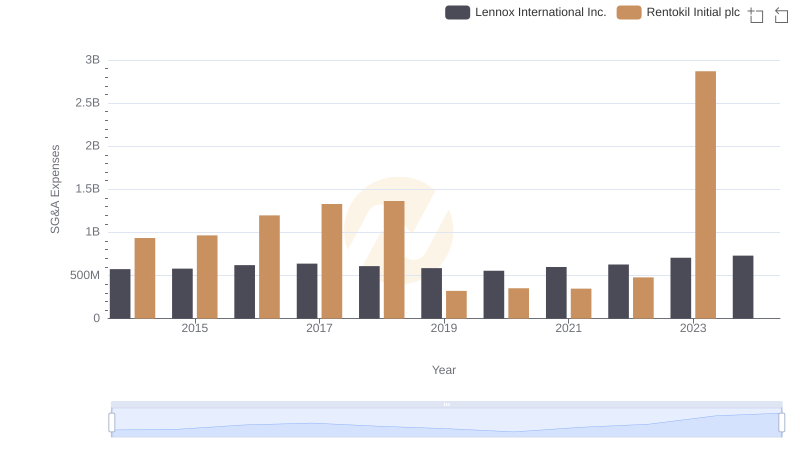
Who Optimizes SG&A Costs Better? Lennox International Inc. or Rentokil Initial plc