| __timestamp | Lennox International Inc. | Pool Corporation |
|---|---|---|
| Wednesday, January 1, 2014 | 573700000 | 454470000 |
| Thursday, January 1, 2015 | 580500000 | 459422000 |
| Friday, January 1, 2016 | 621000000 | 485228000 |
| Sunday, January 1, 2017 | 637700000 | 520918000 |
| Monday, January 1, 2018 | 608200000 | 556284000 |
| Tuesday, January 1, 2019 | 585900000 | 583679000 |
| Wednesday, January 1, 2020 | 555900000 | 659931000 |
| Friday, January 1, 2021 | 598900000 | 786808000 |
| Saturday, January 1, 2022 | 627200000 | 907629000 |
| Sunday, January 1, 2023 | 705500000 | 912927000 |
| Monday, January 1, 2024 | 730600000 |
Igniting the spark of knowledge
In the ever-evolving landscape of corporate finance, Selling, General, and Administrative (SG&A) expenses serve as a critical indicator of a company's operational efficiency. This analysis delves into the SG&A expenses of Lennox International Inc. and Pool Corporation from 2014 to 2023. Over this decade, Lennox International Inc. demonstrated a steady increase in SG&A expenses, peaking at approximately 730 million in 2023, marking a 27% rise from 2014. In contrast, Pool Corporation exhibited a more dynamic growth trajectory, with expenses surging by nearly 101% over the same period, reaching around 913 million in 2023. Notably, 2024 data for Pool Corporation remains unavailable, highlighting a gap in the current financial narrative. This comparison underscores the distinct financial strategies and market responses of these industry leaders, offering valuable insights for investors and analysts alike.
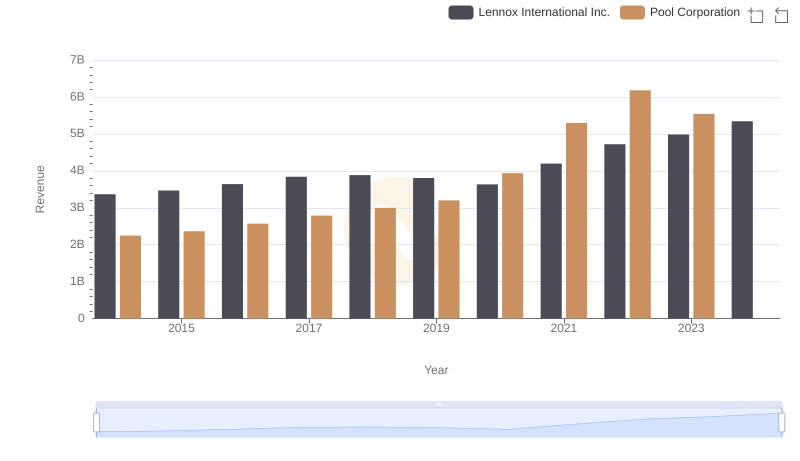
Lennox International Inc. vs Pool Corporation: Annual Revenue Growth Compared
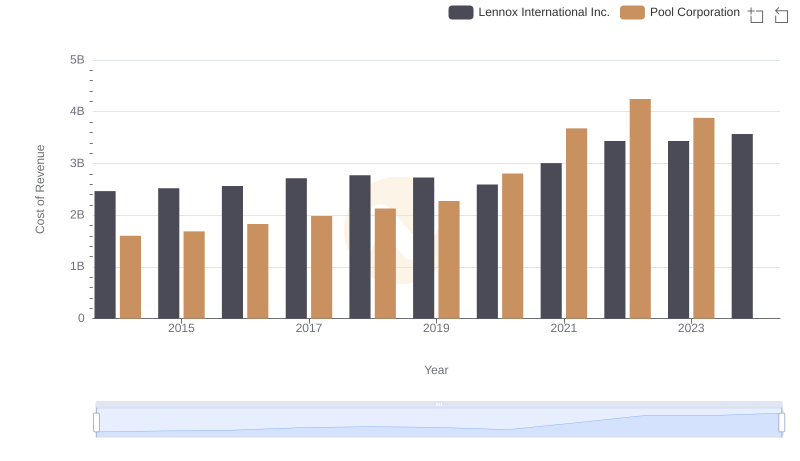
Comparing Cost of Revenue Efficiency: Lennox International Inc. vs Pool Corporation
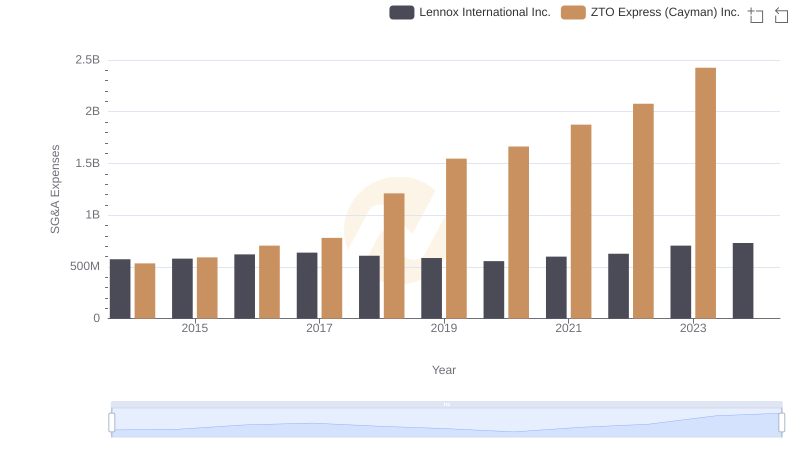
Operational Costs Compared: SG&A Analysis of Lennox International Inc. and ZTO Express (Cayman) Inc.
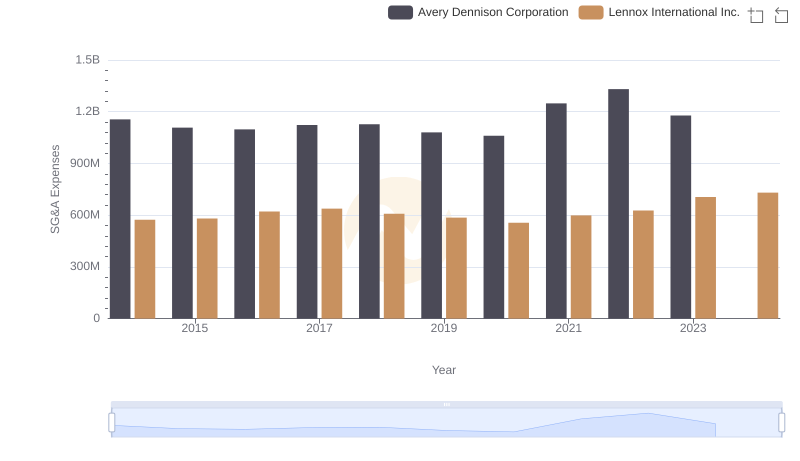
Operational Costs Compared: SG&A Analysis of Lennox International Inc. and Avery Dennison Corporation
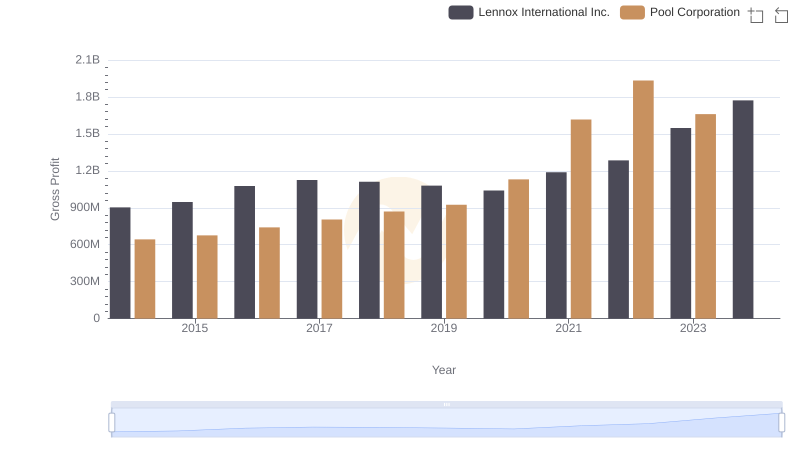
Key Insights on Gross Profit: Lennox International Inc. vs Pool Corporation
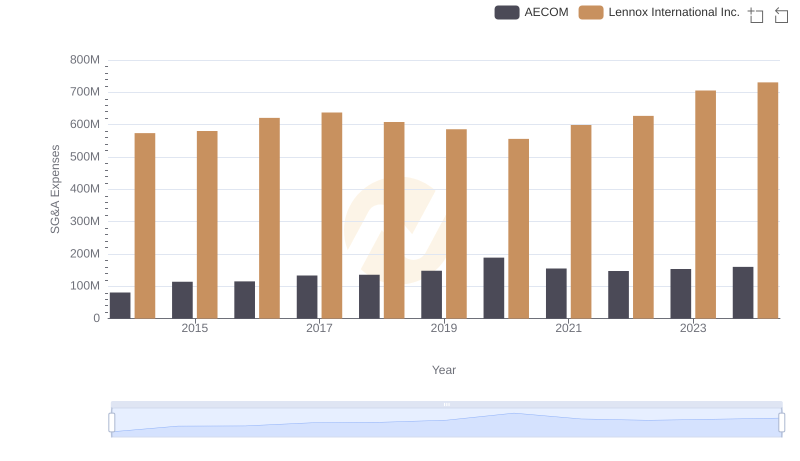
Who Optimizes SG&A Costs Better? Lennox International Inc. or AECOM
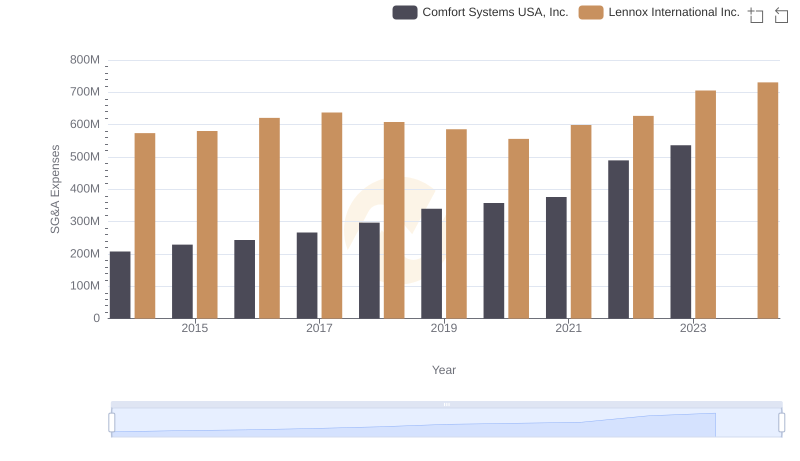
Selling, General, and Administrative Costs: Lennox International Inc. vs Comfort Systems USA, Inc.
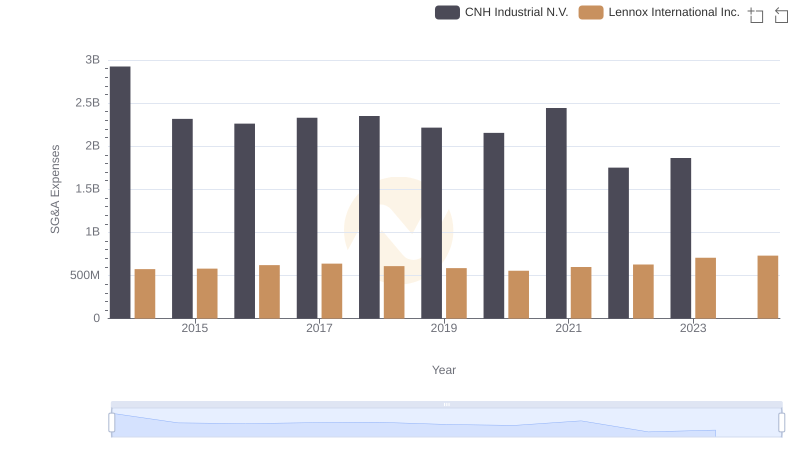
Breaking Down SG&A Expenses: Lennox International Inc. vs CNH Industrial N.V.
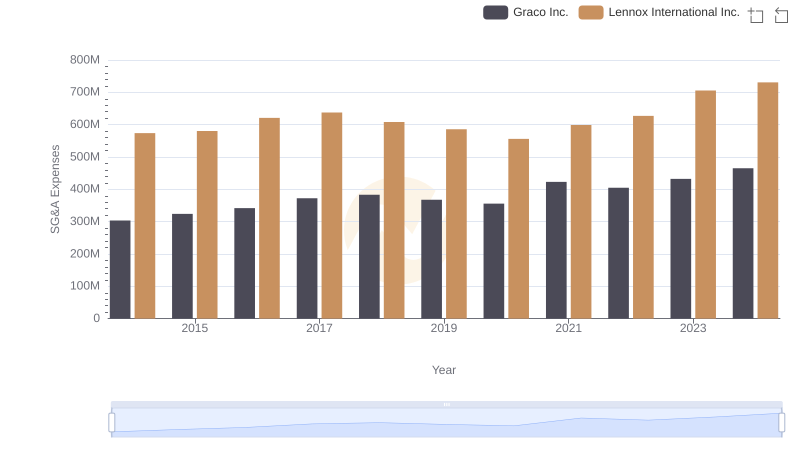
Who Optimizes SG&A Costs Better? Lennox International Inc. or Graco Inc.
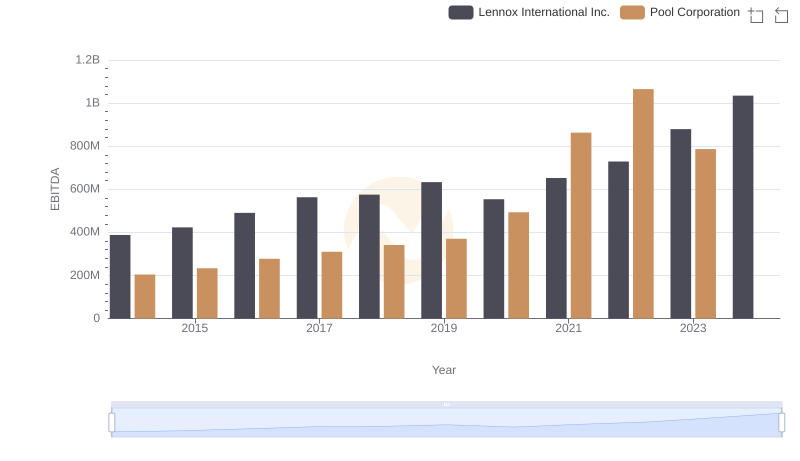
EBITDA Analysis: Evaluating Lennox International Inc. Against Pool Corporation
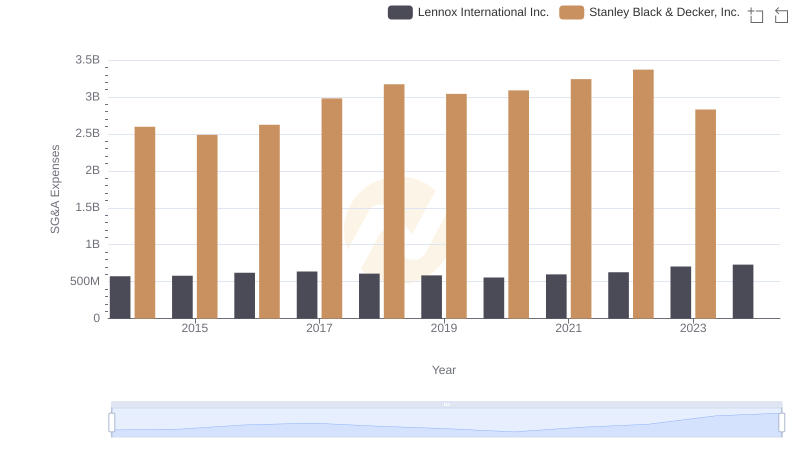
Comparing SG&A Expenses: Lennox International Inc. vs Stanley Black & Decker, Inc. Trends and Insights

Lennox International Inc. vs Saia, Inc.: SG&A Expense Trends