| __timestamp | Comfort Systems USA, Inc. | Lennox International Inc. |
|---|---|---|
| Wednesday, January 1, 2014 | 207652000 | 573700000 |
| Thursday, January 1, 2015 | 228965000 | 580500000 |
| Friday, January 1, 2016 | 243201000 | 621000000 |
| Sunday, January 1, 2017 | 266586000 | 637700000 |
| Monday, January 1, 2018 | 296986000 | 608200000 |
| Tuesday, January 1, 2019 | 340005000 | 585900000 |
| Wednesday, January 1, 2020 | 357777000 | 555900000 |
| Friday, January 1, 2021 | 376309000 | 598900000 |
| Saturday, January 1, 2022 | 489344000 | 627200000 |
| Sunday, January 1, 2023 | 536188999 | 705500000 |
| Monday, January 1, 2024 | 730600000 |
Unleashing the power of data
In the competitive landscape of the HVAC industry, understanding the financial strategies of key players is crucial. Over the past decade, Lennox International Inc. and Comfort Systems USA, Inc. have demonstrated distinct approaches to managing their Selling, General, and Administrative (SG&A) expenses. From 2014 to 2023, Lennox consistently maintained higher SG&A costs, peaking at approximately 730 million in 2023, reflecting a strategic investment in operational efficiency and market expansion. In contrast, Comfort Systems USA, Inc. exhibited a steady growth in SG&A expenses, culminating in a 158% increase over the same period, reaching around 536 million in 2023. This divergence highlights Lennox's aggressive market positioning compared to Comfort Systems' more conservative financial management. Notably, data for Comfort Systems in 2024 is unavailable, suggesting potential shifts in their financial reporting or strategy.
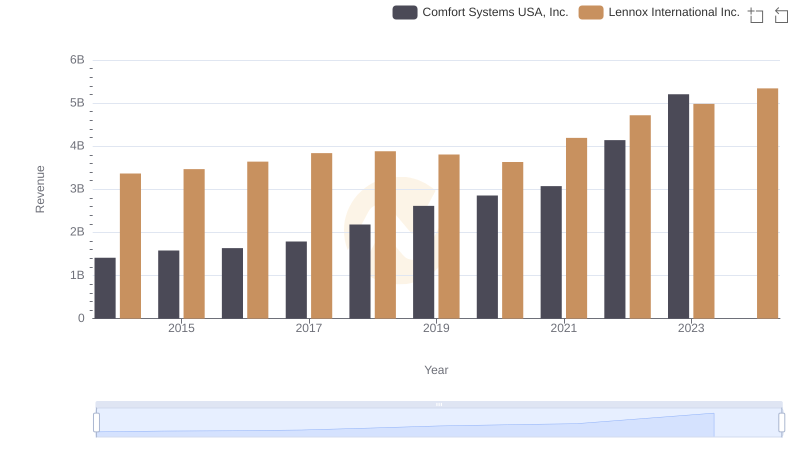
Lennox International Inc. vs Comfort Systems USA, Inc.: Annual Revenue Growth Compared
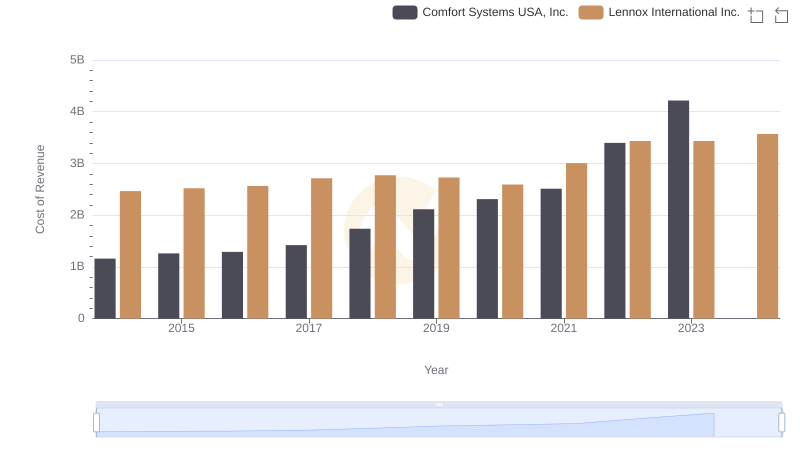
Cost of Revenue Trends: Lennox International Inc. vs Comfort Systems USA, Inc.
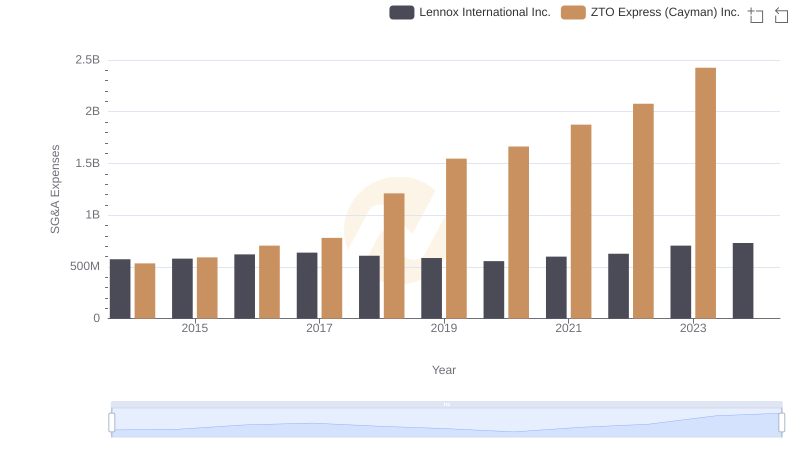
Operational Costs Compared: SG&A Analysis of Lennox International Inc. and ZTO Express (Cayman) Inc.
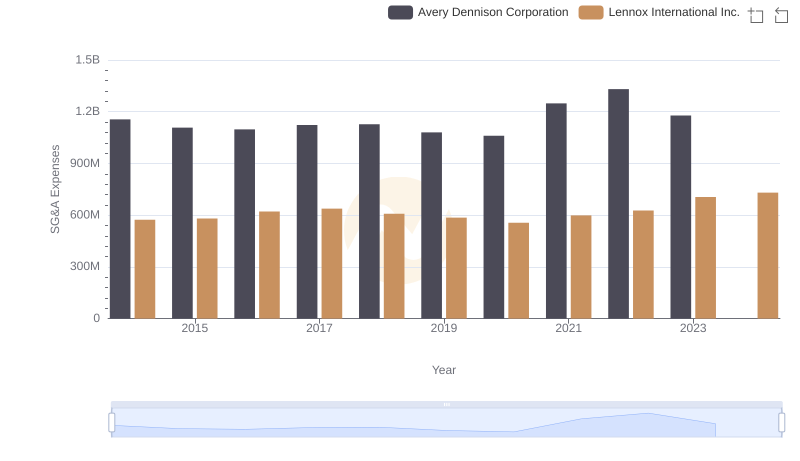
Operational Costs Compared: SG&A Analysis of Lennox International Inc. and Avery Dennison Corporation
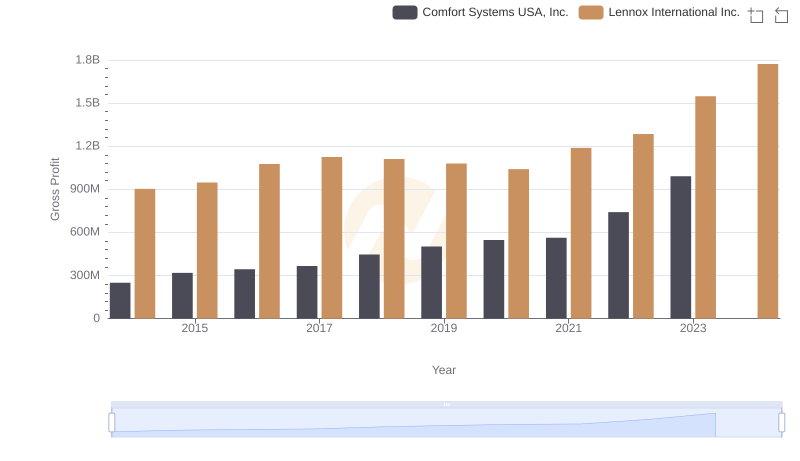
Lennox International Inc. and Comfort Systems USA, Inc.: A Detailed Gross Profit Analysis
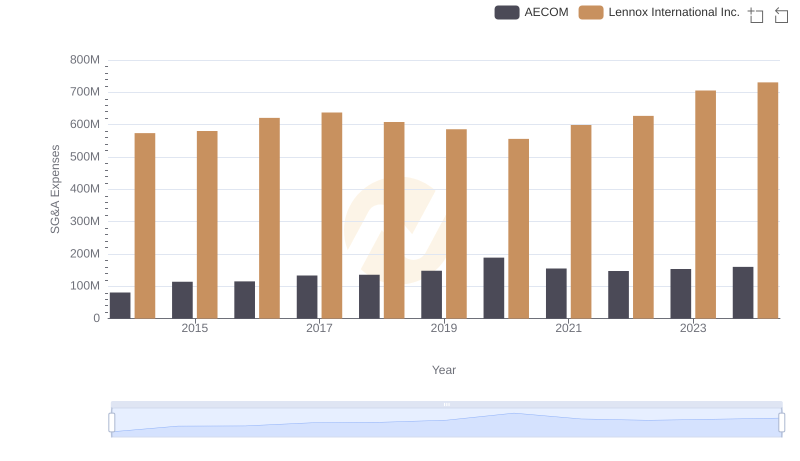
Who Optimizes SG&A Costs Better? Lennox International Inc. or AECOM
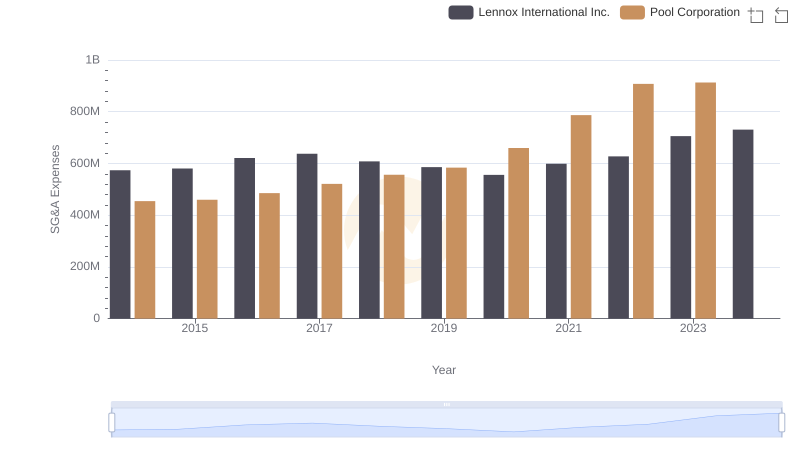
Selling, General, and Administrative Costs: Lennox International Inc. vs Pool Corporation
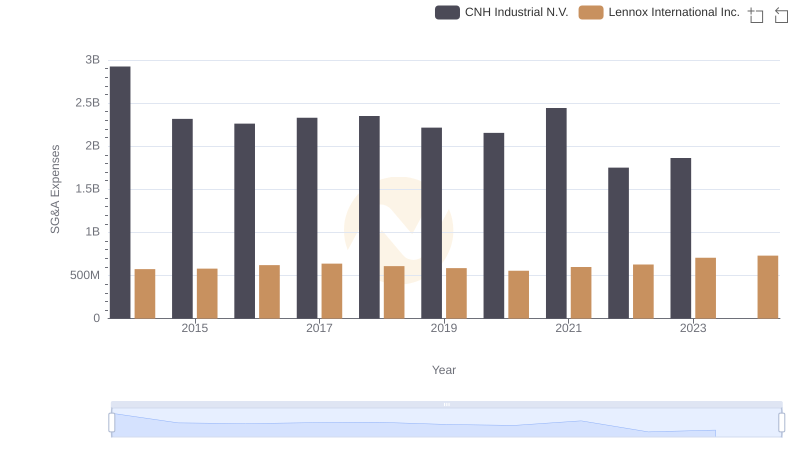
Breaking Down SG&A Expenses: Lennox International Inc. vs CNH Industrial N.V.
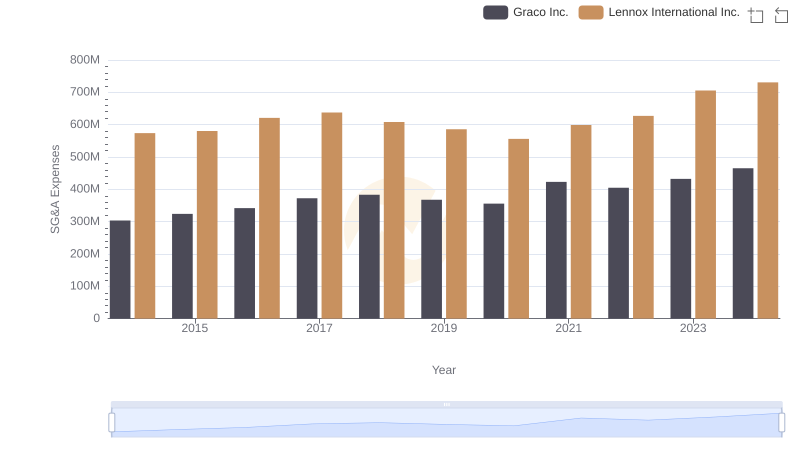
Who Optimizes SG&A Costs Better? Lennox International Inc. or Graco Inc.
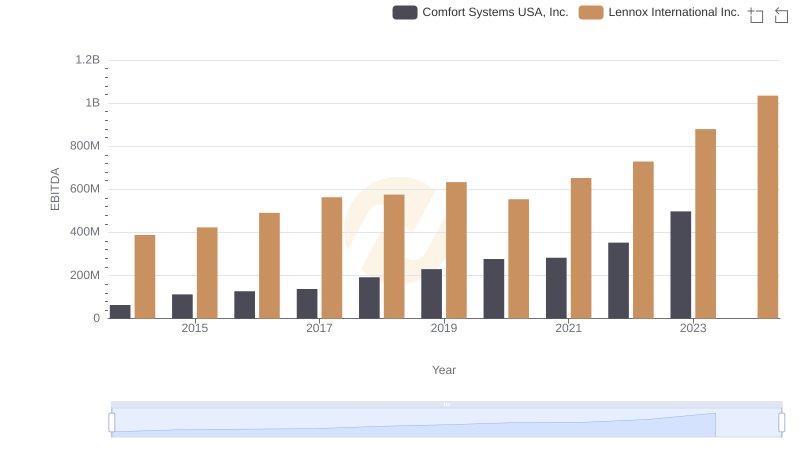
A Professional Review of EBITDA: Lennox International Inc. Compared to Comfort Systems USA, Inc.
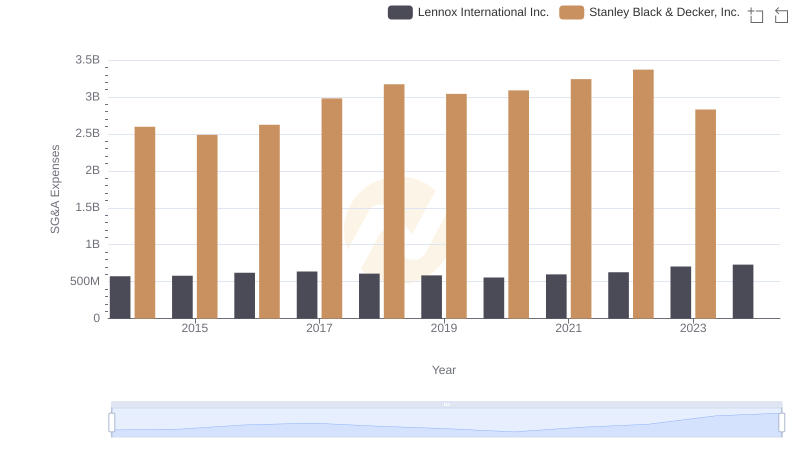
Comparing SG&A Expenses: Lennox International Inc. vs Stanley Black & Decker, Inc. Trends and Insights

Lennox International Inc. vs Saia, Inc.: SG&A Expense Trends