| __timestamp | AECOM | Lennox International Inc. |
|---|---|---|
| Wednesday, January 1, 2014 | 403176000 | 903300000 |
| Thursday, January 1, 2015 | 535188000 | 947400000 |
| Friday, January 1, 2016 | 642824000 | 1076500000 |
| Sunday, January 1, 2017 | 683720000 | 1125200000 |
| Monday, January 1, 2018 | 650649000 | 1111200000 |
| Tuesday, January 1, 2019 | 813445000 | 1079800000 |
| Wednesday, January 1, 2020 | 709560000 | 1040100000 |
| Friday, January 1, 2021 | 798421000 | 1188400000 |
| Saturday, January 1, 2022 | 847974000 | 1284700000 |
| Sunday, January 1, 2023 | 945465000 | 1547800000 |
| Monday, January 1, 2024 | 1084341000 | 1771900000 |
Data in motion
In the competitive landscape of industrial giants, Lennox International Inc. and AECOM have showcased remarkable trajectories in gross profit performance over the past decade. From 2014 to 2024, Lennox International Inc. consistently outperformed AECOM, with an average gross profit approximately 60% higher. Notably, Lennox's gross profit surged by nearly 96% from 2014 to 2024, reflecting its robust market strategies and operational efficiencies. In contrast, AECOM demonstrated a steady growth of about 169% during the same period, indicating its resilience and adaptability in a dynamic market. The year 2023 marked a significant milestone for both companies, with Lennox achieving a gross profit of 1.55 billion, while AECOM reached 945 million. As we look towards 2024, Lennox's projected gross profit of 1.77 billion further cements its leadership position. This analysis underscores the strategic prowess and market positioning of these industrial titans.
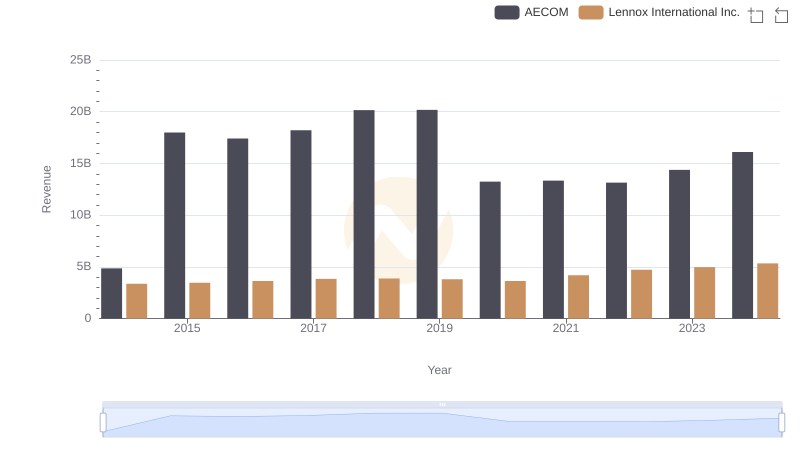
Lennox International Inc. vs AECOM: Examining Key Revenue Metrics
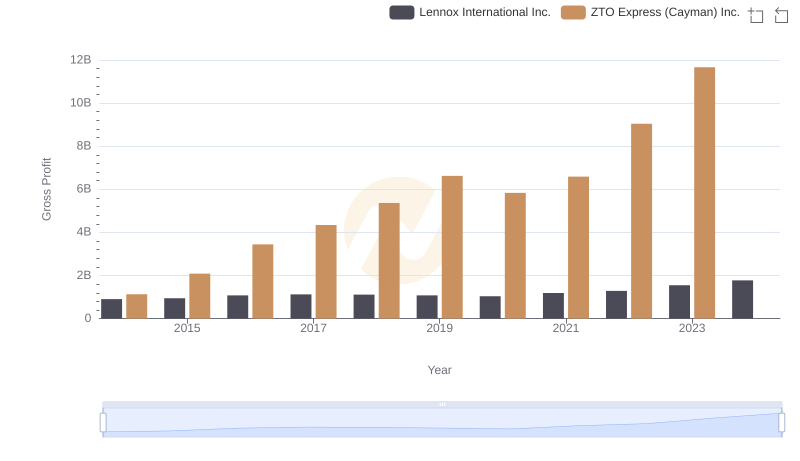
Gross Profit Comparison: Lennox International Inc. and ZTO Express (Cayman) Inc. Trends
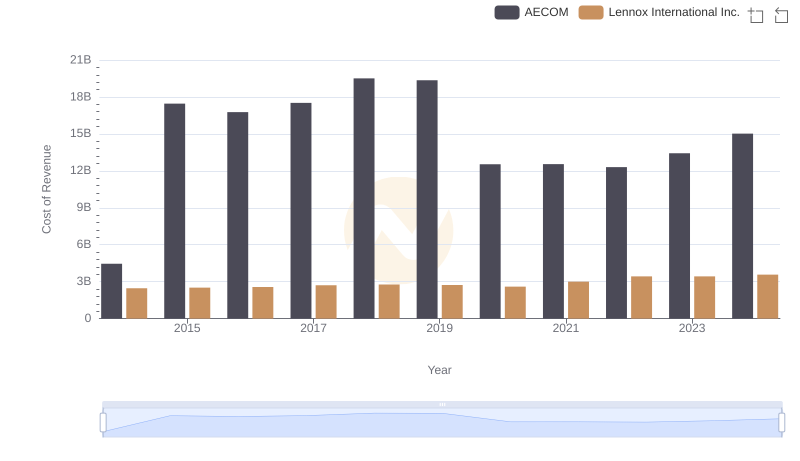
Cost of Revenue Trends: Lennox International Inc. vs AECOM
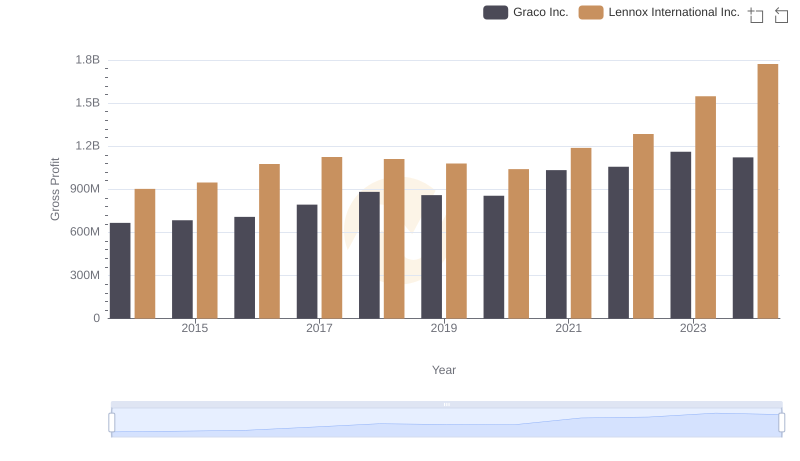
Lennox International Inc. and Graco Inc.: A Detailed Gross Profit Analysis
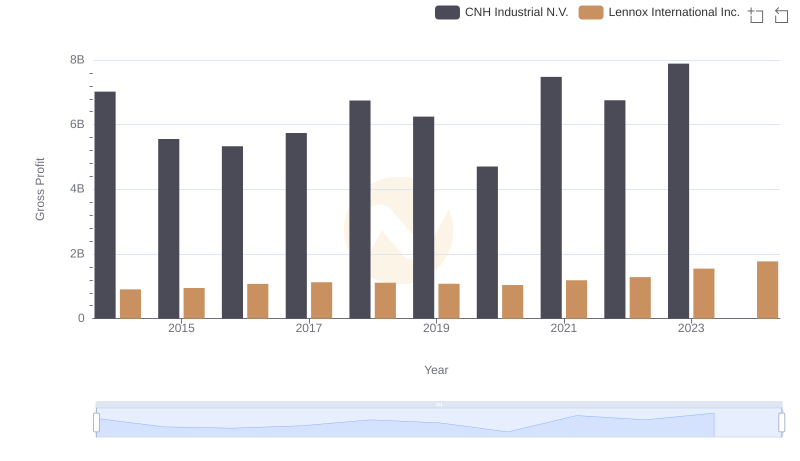
Lennox International Inc. and CNH Industrial N.V.: A Detailed Gross Profit Analysis
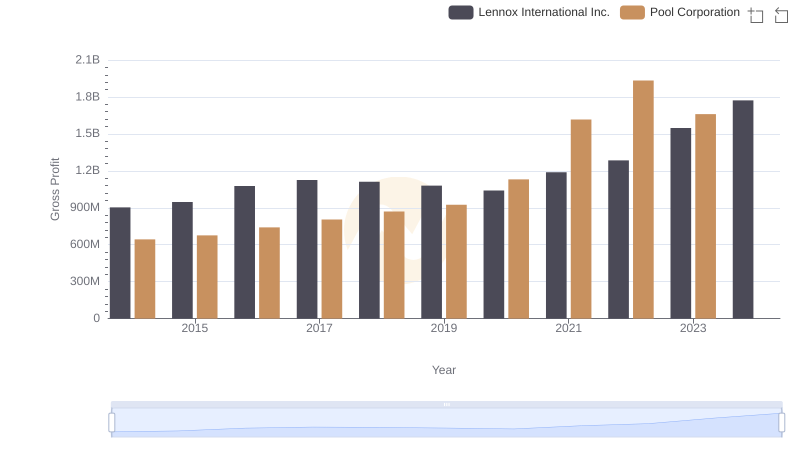
Key Insights on Gross Profit: Lennox International Inc. vs Pool Corporation
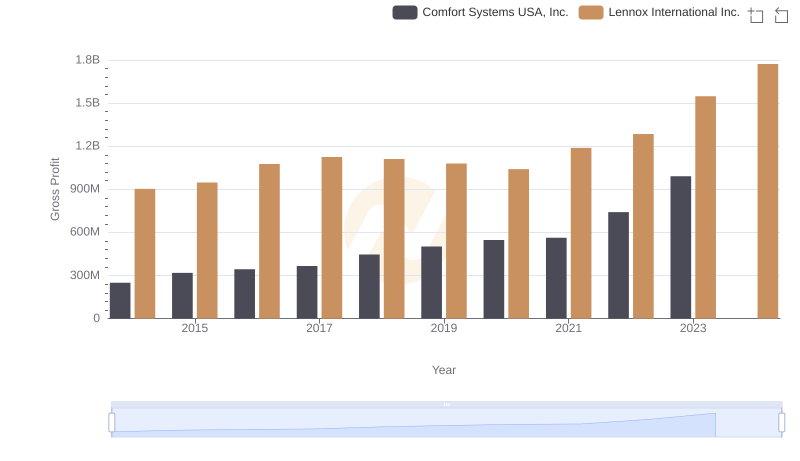
Lennox International Inc. and Comfort Systems USA, Inc.: A Detailed Gross Profit Analysis
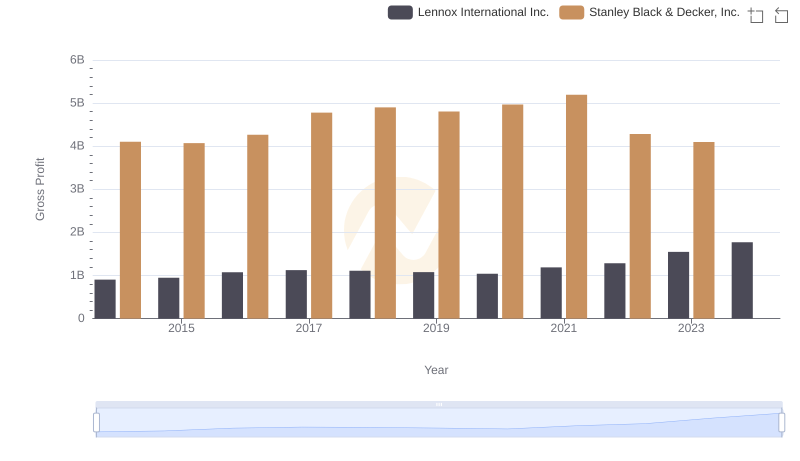
Lennox International Inc. vs Stanley Black & Decker, Inc.: A Gross Profit Performance Breakdown
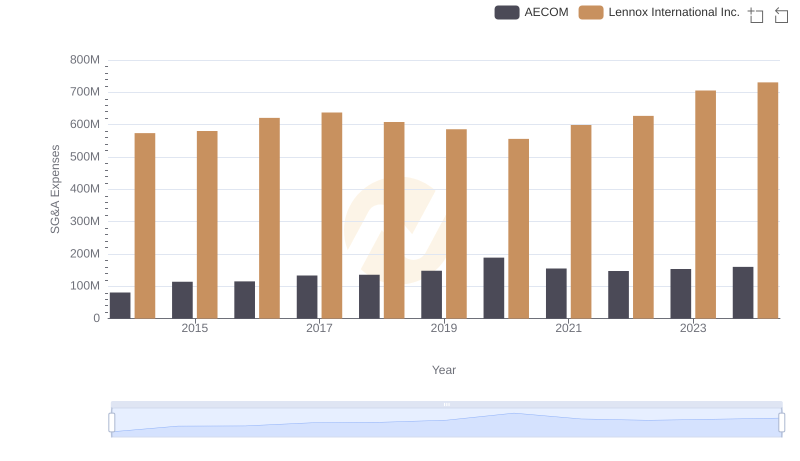
Who Optimizes SG&A Costs Better? Lennox International Inc. or AECOM
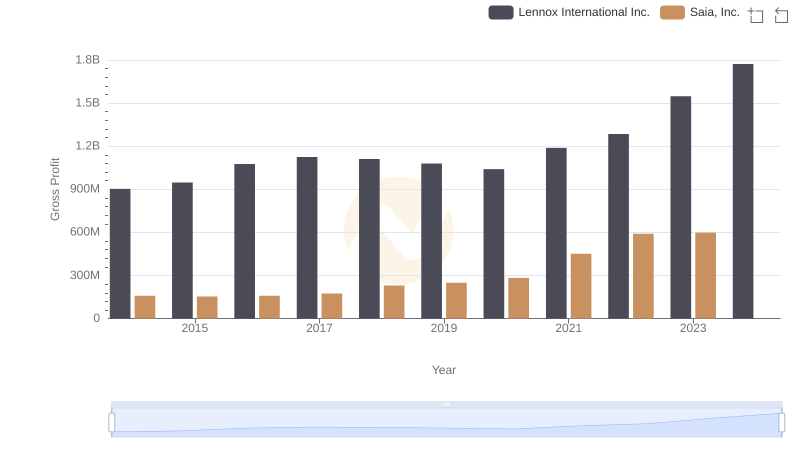
Gross Profit Trends Compared: Lennox International Inc. vs Saia, Inc.
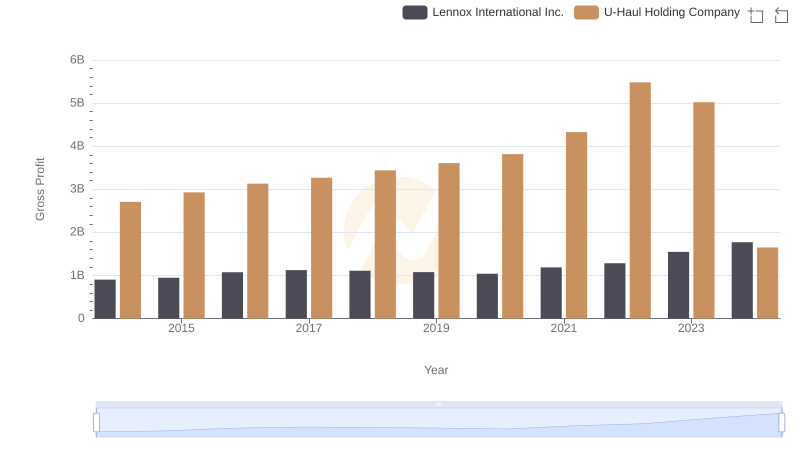
Lennox International Inc. vs U-Haul Holding Company: A Gross Profit Performance Breakdown
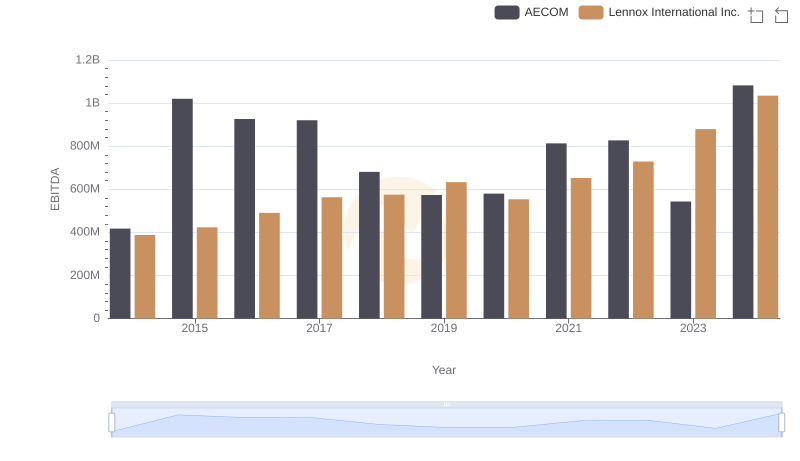
EBITDA Analysis: Evaluating Lennox International Inc. Against AECOM