| __timestamp | CNH Industrial N.V. | Lennox International Inc. |
|---|---|---|
| Wednesday, January 1, 2014 | 2925000000 | 573700000 |
| Thursday, January 1, 2015 | 2317000000 | 580500000 |
| Friday, January 1, 2016 | 2262000000 | 621000000 |
| Sunday, January 1, 2017 | 2330000000 | 637700000 |
| Monday, January 1, 2018 | 2351000000 | 608200000 |
| Tuesday, January 1, 2019 | 2216000000 | 585900000 |
| Wednesday, January 1, 2020 | 2155000000 | 555900000 |
| Friday, January 1, 2021 | 2443000000 | 598900000 |
| Saturday, January 1, 2022 | 1752000000 | 627200000 |
| Sunday, January 1, 2023 | 1863000000 | 705500000 |
| Monday, January 1, 2024 | 730600000 |
Infusing magic into the data realm
In the ever-evolving landscape of industrial giants, understanding the financial intricacies of companies like Lennox International Inc. and CNH Industrial N.V. is crucial. Over the past decade, these two companies have showcased distinct trends in their Selling, General, and Administrative (SG&A) expenses. From 2014 to 2023, CNH Industrial N.V. experienced a notable decline in SG&A expenses, dropping from a peak of approximately $2.9 billion in 2014 to around $1.9 billion in 2023, marking a reduction of nearly 35%. In contrast, Lennox International Inc. has seen a steady increase, with expenses rising from about $574 million in 2014 to $706 million in 2023, reflecting a growth of approximately 23%. This divergence highlights the strategic financial management and operational efficiencies that each company has prioritized over the years. However, the data for 2024 remains incomplete, leaving room for speculation on future trends.
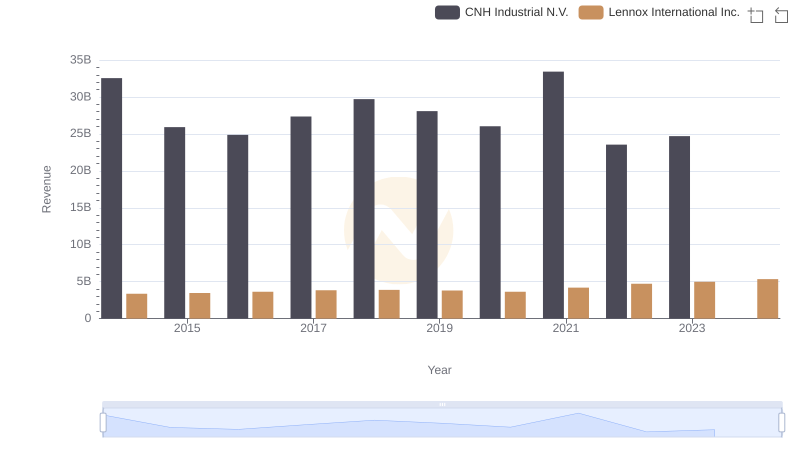
Lennox International Inc. and CNH Industrial N.V.: A Comprehensive Revenue Analysis
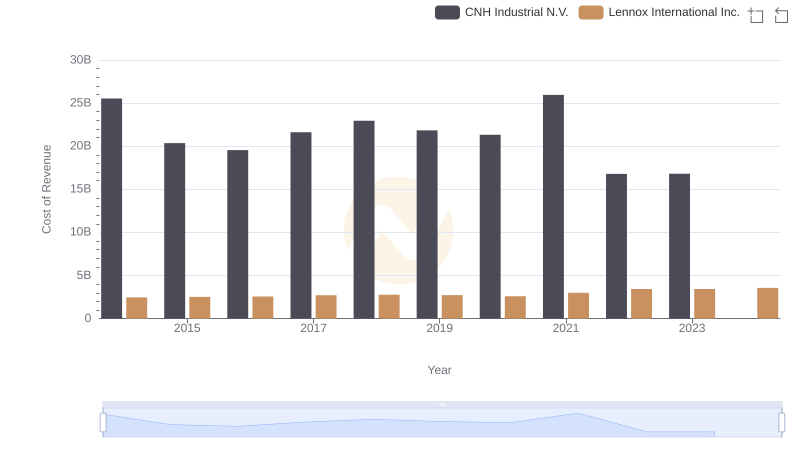
Cost of Revenue Trends: Lennox International Inc. vs CNH Industrial N.V.
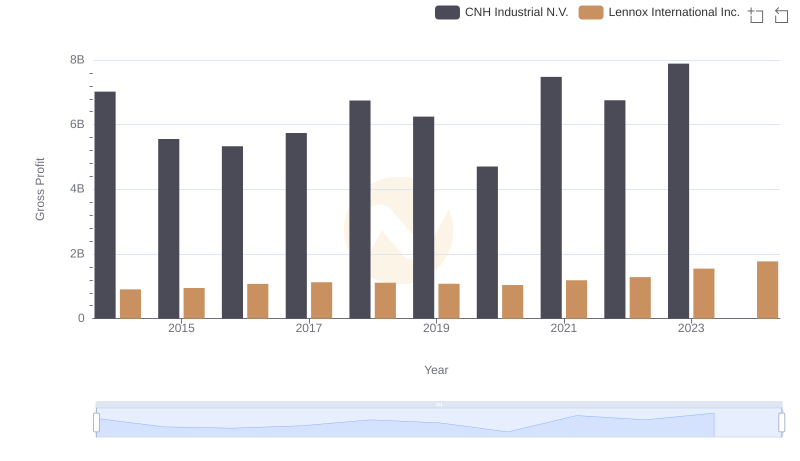
Lennox International Inc. and CNH Industrial N.V.: A Detailed Gross Profit Analysis
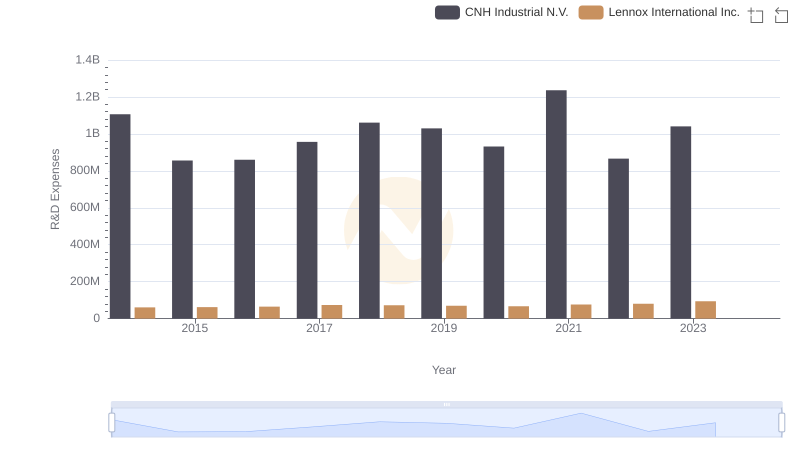
Comparing Innovation Spending: Lennox International Inc. and CNH Industrial N.V.
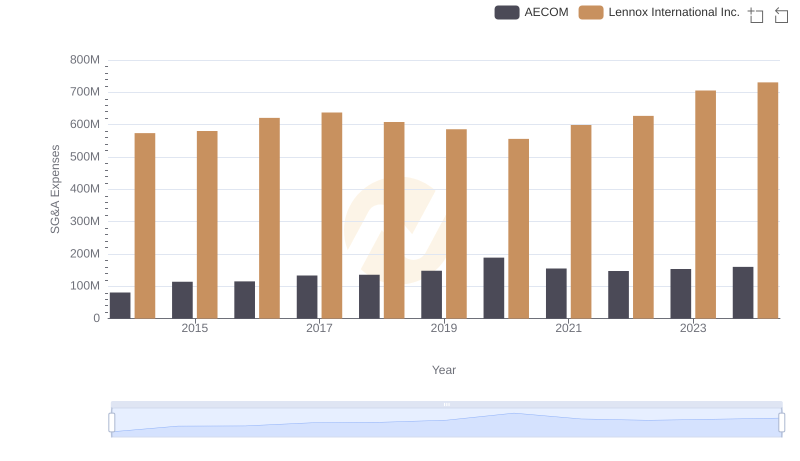
Who Optimizes SG&A Costs Better? Lennox International Inc. or AECOM
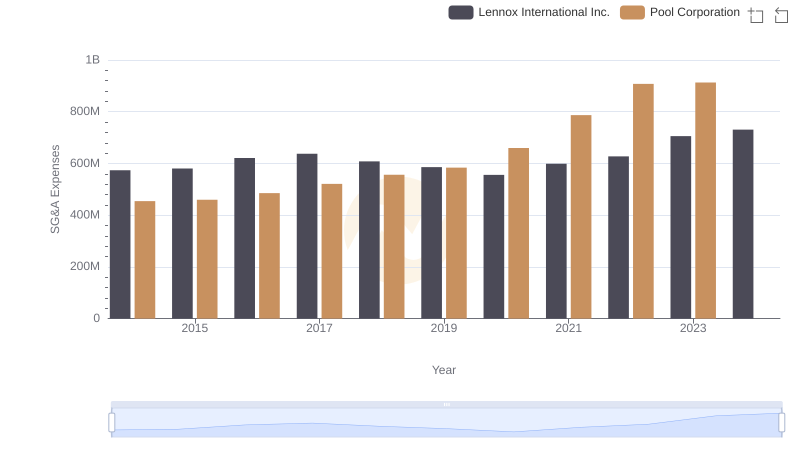
Selling, General, and Administrative Costs: Lennox International Inc. vs Pool Corporation
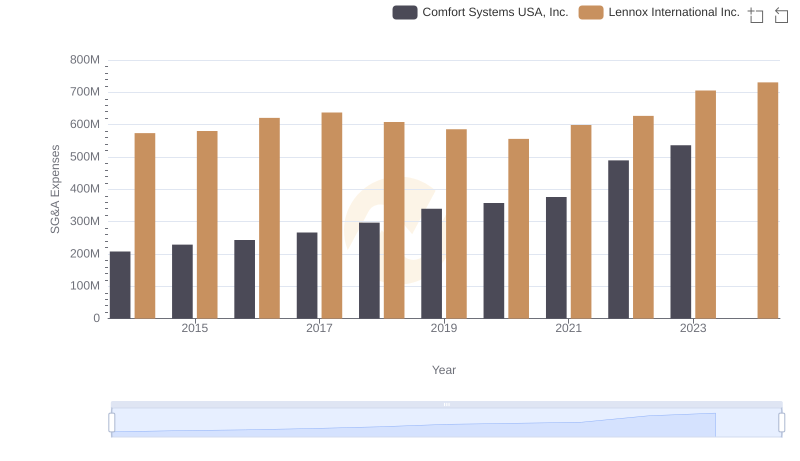
Selling, General, and Administrative Costs: Lennox International Inc. vs Comfort Systems USA, Inc.
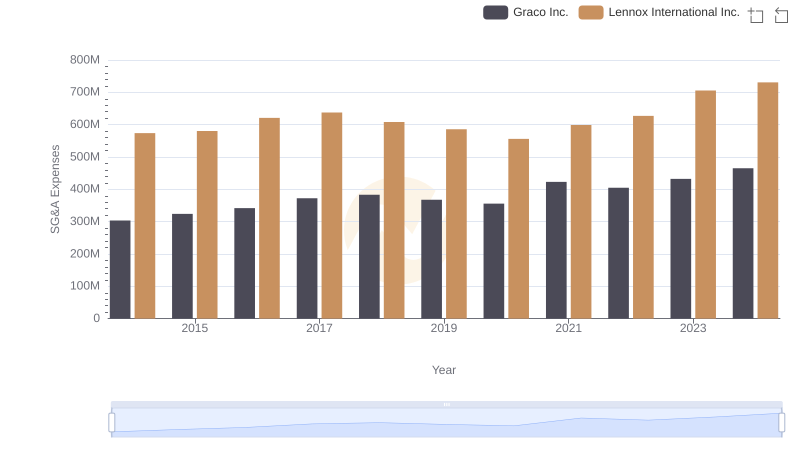
Who Optimizes SG&A Costs Better? Lennox International Inc. or Graco Inc.
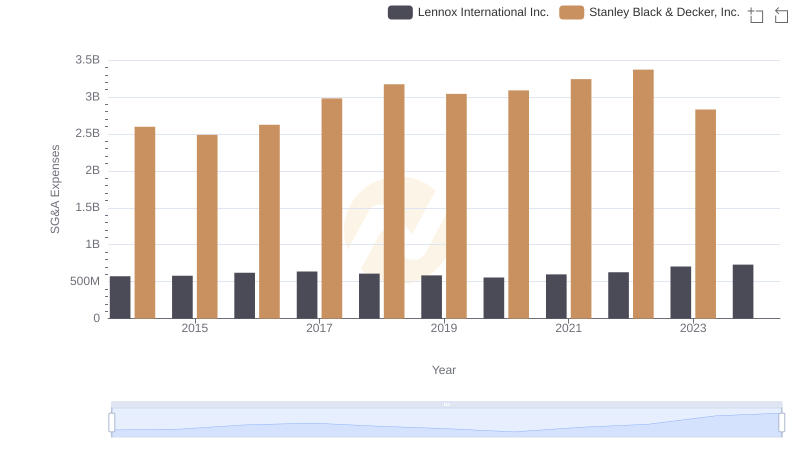
Comparing SG&A Expenses: Lennox International Inc. vs Stanley Black & Decker, Inc. Trends and Insights
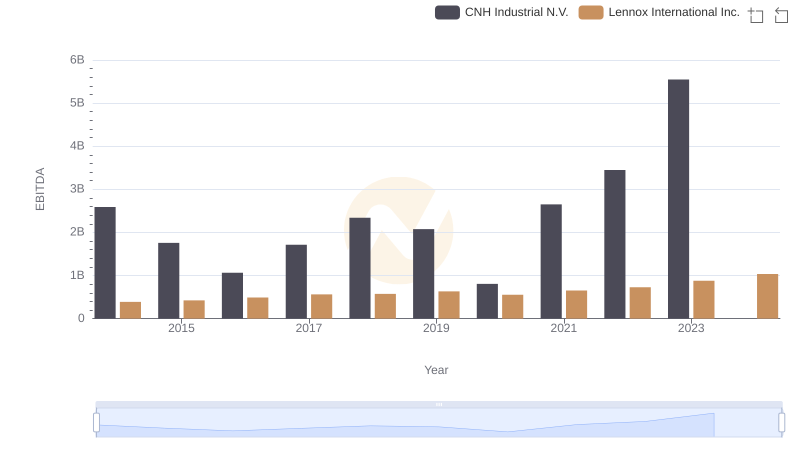
Comprehensive EBITDA Comparison: Lennox International Inc. vs CNH Industrial N.V.

Lennox International Inc. vs Saia, Inc.: SG&A Expense Trends
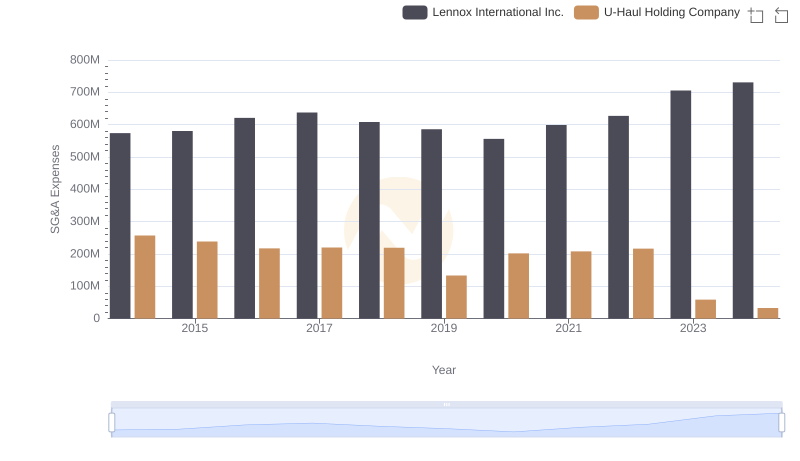
Selling, General, and Administrative Costs: Lennox International Inc. vs U-Haul Holding Company