| __timestamp | Cintas Corporation | TransUnion |
|---|---|---|
| Wednesday, January 1, 2014 | 1302752000 | 436000000 |
| Thursday, January 1, 2015 | 1224930000 | 499700000 |
| Friday, January 1, 2016 | 1348122000 | 560100000 |
| Sunday, January 1, 2017 | 1527380000 | 585400000 |
| Monday, January 1, 2018 | 1916792000 | 707700000 |
| Tuesday, January 1, 2019 | 1980644000 | 812100000 |
| Wednesday, January 1, 2020 | 2071052000 | 860300000 |
| Friday, January 1, 2021 | 1929159000 | 943900000 |
| Saturday, January 1, 2022 | 2044876000 | 1337400000 |
| Sunday, January 1, 2023 | 2370704000 | 1171600000 |
| Monday, January 1, 2024 | 2617783000 | 1239300000 |
Cracking the code
In the competitive landscape of corporate America, managing Selling, General, and Administrative (SG&A) expenses is crucial for profitability. Cintas Corporation and TransUnion, two industry giants, have shown distinct strategies in optimizing these costs over the past decade.
From 2014 to 2023, Cintas Corporation has seen a consistent increase in SG&A expenses, peaking at approximately $2.37 billion in 2023. This represents an 82% rise from their 2014 figures. Despite the increase, Cintas has maintained a robust growth trajectory, suggesting effective cost management relative to revenue growth.
TransUnion, on the other hand, has experienced a more moderate increase in SG&A expenses, with a notable peak in 2022 at around $1.34 billion. This marks a 207% increase from 2014, indicating a more aggressive expansion strategy.
While Cintas shows a steady and controlled growth in expenses, TransUnion's strategy reflects a more dynamic approach, albeit with some missing data for 2024. The comparison highlights the diverse strategies companies employ to optimize operational costs.
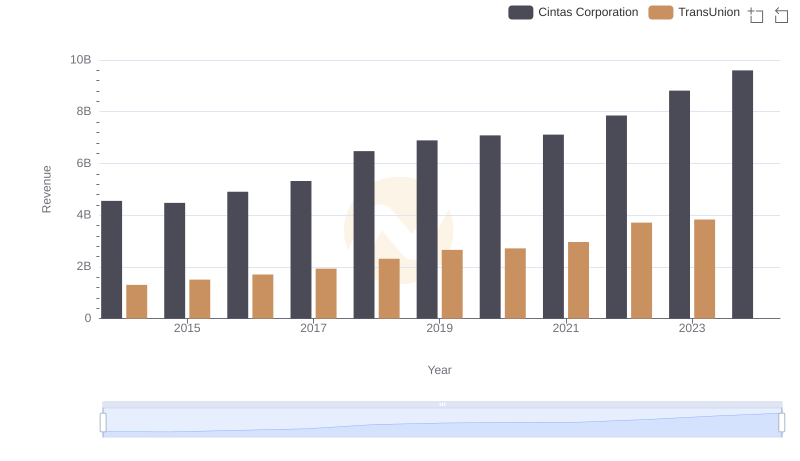
Cintas Corporation or TransUnion: Who Leads in Yearly Revenue?
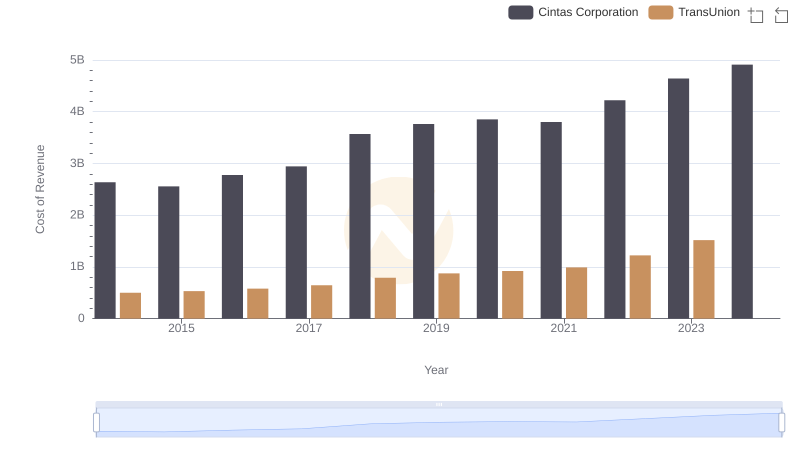
Cost of Revenue Trends: Cintas Corporation vs TransUnion
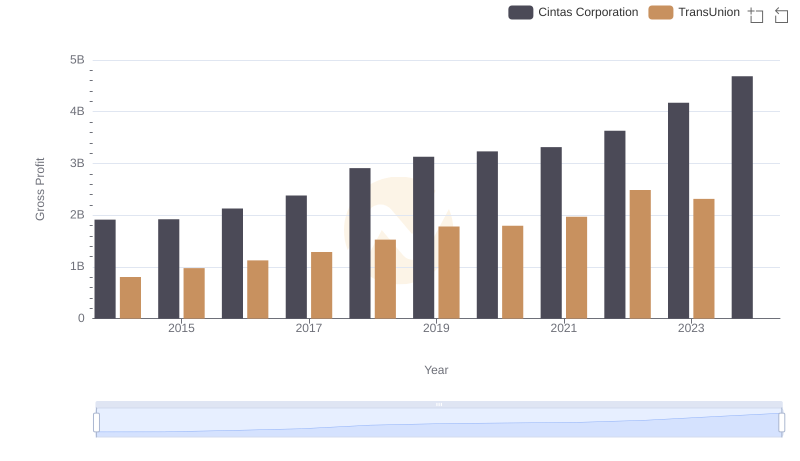
Gross Profit Trends Compared: Cintas Corporation vs TransUnion
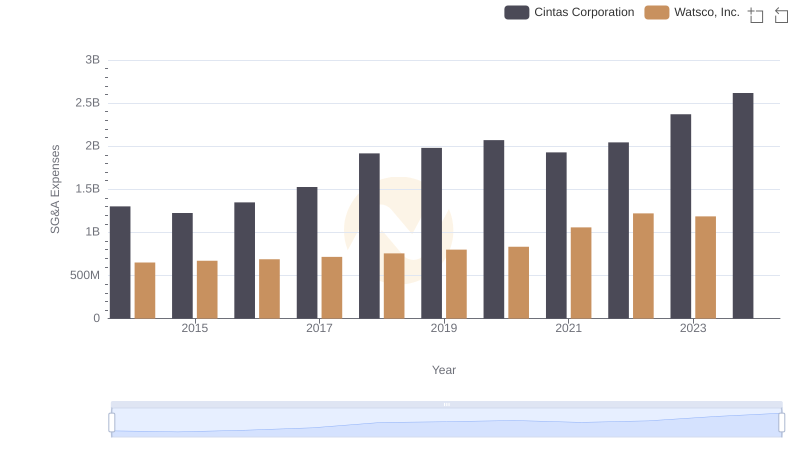
Cintas Corporation vs Watsco, Inc.: SG&A Expense Trends
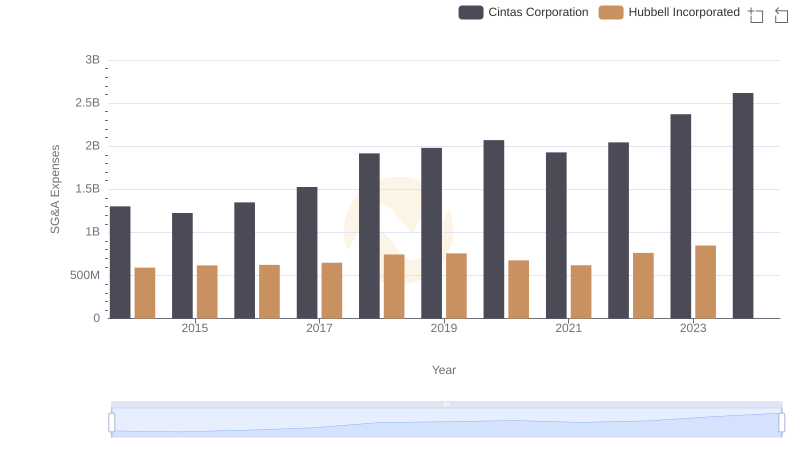
SG&A Efficiency Analysis: Comparing Cintas Corporation and Hubbell Incorporated
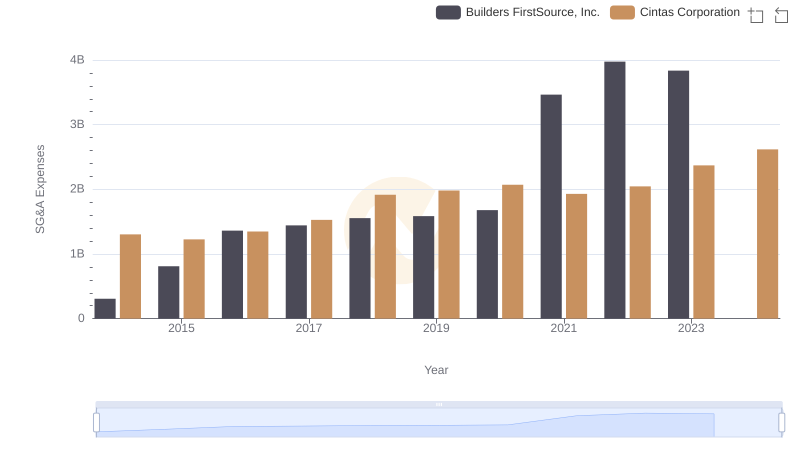
Breaking Down SG&A Expenses: Cintas Corporation vs Builders FirstSource, Inc.
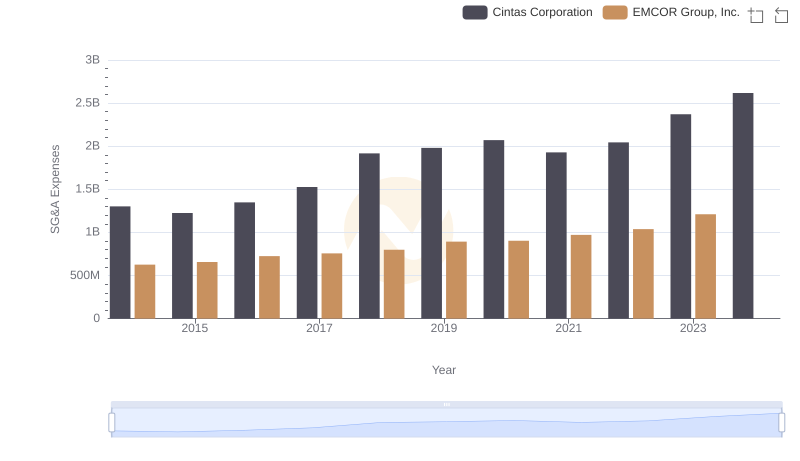
Comparing SG&A Expenses: Cintas Corporation vs EMCOR Group, Inc. Trends and Insights
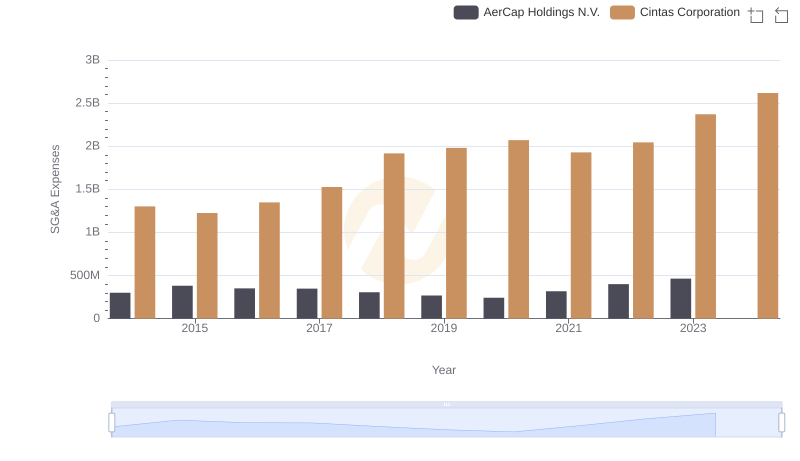
Selling, General, and Administrative Costs: Cintas Corporation vs AerCap Holdings N.V.
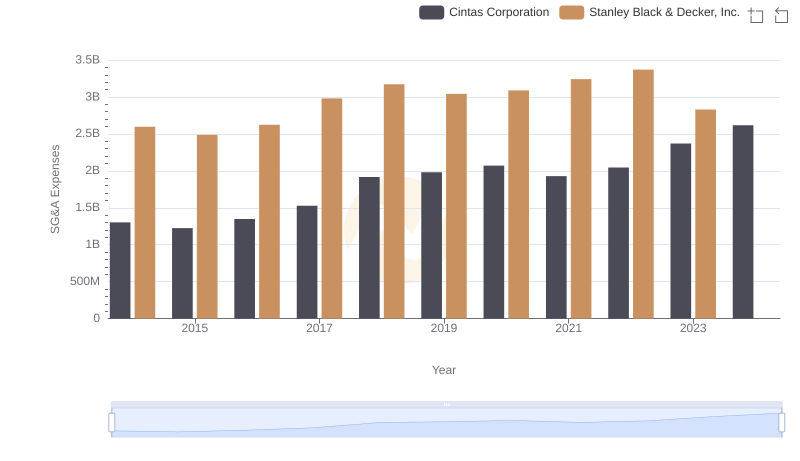
Operational Costs Compared: SG&A Analysis of Cintas Corporation and Stanley Black & Decker, Inc.
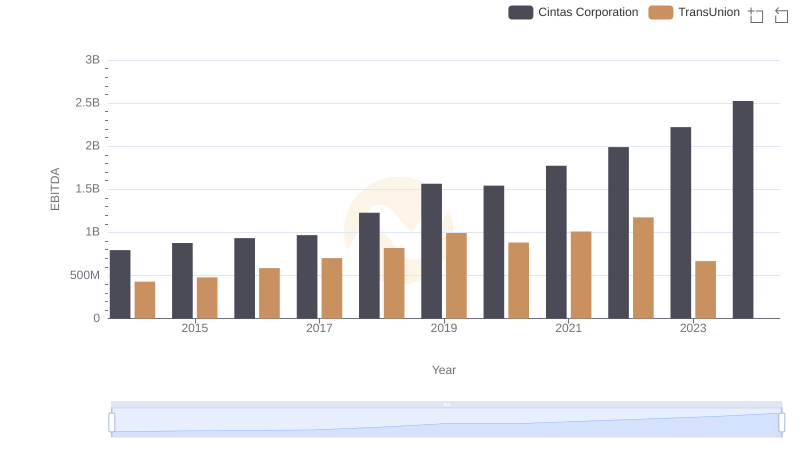
EBITDA Performance Review: Cintas Corporation vs TransUnion
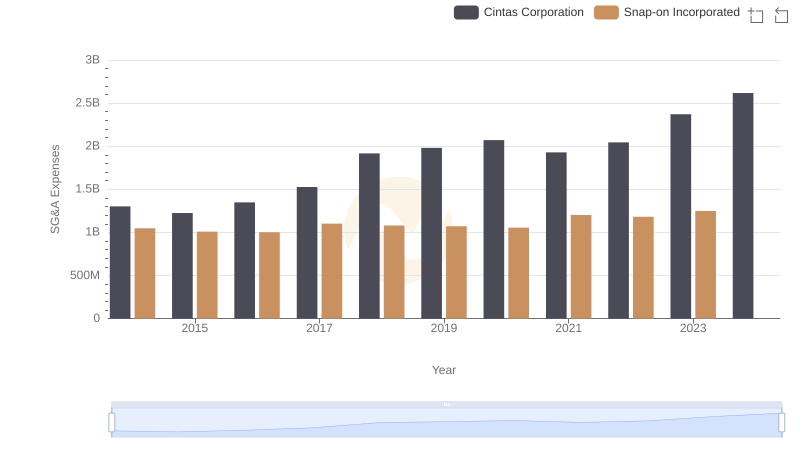
Selling, General, and Administrative Costs: Cintas Corporation vs Snap-on Incorporated
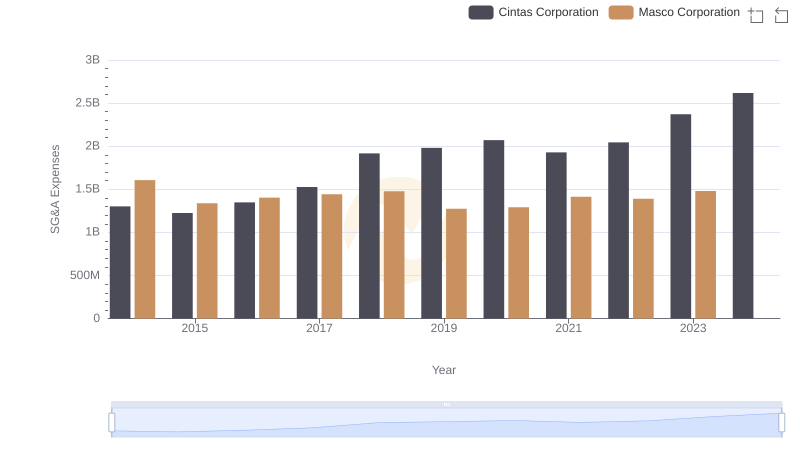
Cintas Corporation vs Masco Corporation: SG&A Expense Trends