| __timestamp | Cintas Corporation | TransUnion |
|---|---|---|
| Wednesday, January 1, 2014 | 2637426000 | 499100000 |
| Thursday, January 1, 2015 | 2555549000 | 531600000 |
| Friday, January 1, 2016 | 2775588000 | 579100000 |
| Sunday, January 1, 2017 | 2943086000 | 645700000 |
| Monday, January 1, 2018 | 3568109000 | 790100000 |
| Tuesday, January 1, 2019 | 3763715000 | 874100000 |
| Wednesday, January 1, 2020 | 3851372000 | 920400000 |
| Friday, January 1, 2021 | 3801689000 | 991600000 |
| Saturday, January 1, 2022 | 4222213000 | 1222900000 |
| Sunday, January 1, 2023 | 4642401000 | 1517300000 |
| Monday, January 1, 2024 | 4910199000 | 0 |
Unveiling the hidden dimensions of data
In the ever-evolving landscape of corporate finance, understanding cost structures is crucial. This analysis delves into the cost of revenue trends for Cintas Corporation and TransUnion from 2014 to 2023. Cintas, a leader in corporate uniforms and facility services, has seen its cost of revenue grow by approximately 86% over the decade, reflecting its expanding operations and market reach. In contrast, TransUnion, a global information and insights company, experienced a 204% increase, highlighting its aggressive growth strategy in data analytics. Notably, Cintas consistently outpaces TransUnion in absolute terms, underscoring its larger operational scale. However, the data for 2024 is incomplete, leaving room for speculation on future trajectories. This comparative analysis not only sheds light on the financial health of these corporations but also offers insights into their strategic priorities in a competitive market.
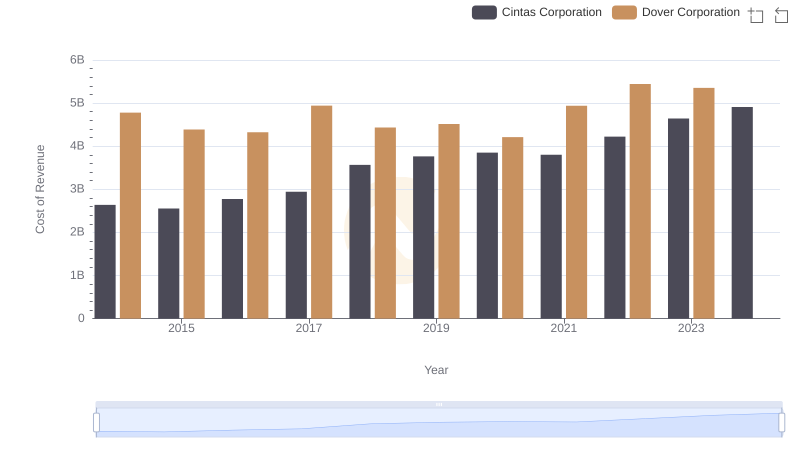
Cost of Revenue Trends: Cintas Corporation vs Dover Corporation
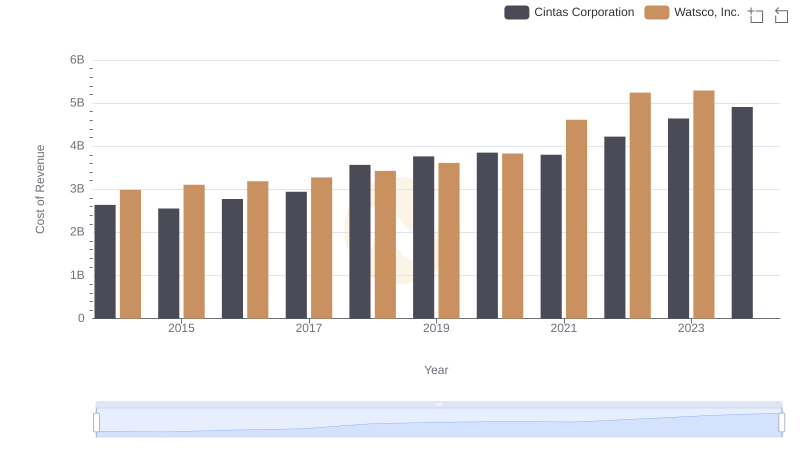
Cost of Revenue: Key Insights for Cintas Corporation and Watsco, Inc.
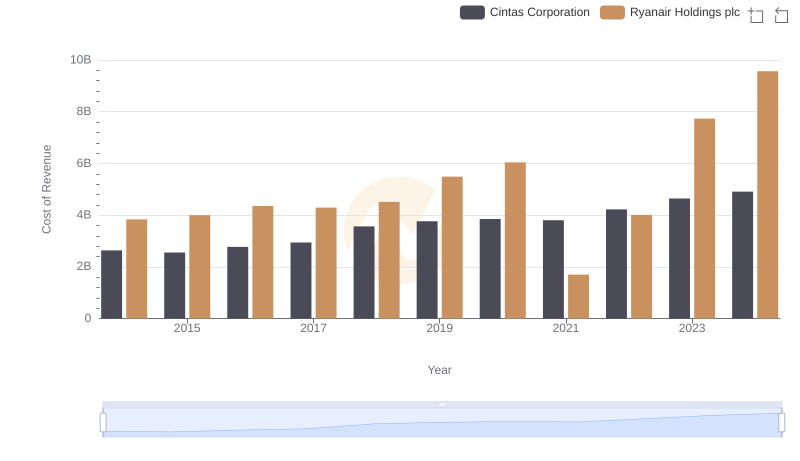
Cost Insights: Breaking Down Cintas Corporation and Ryanair Holdings plc's Expenses
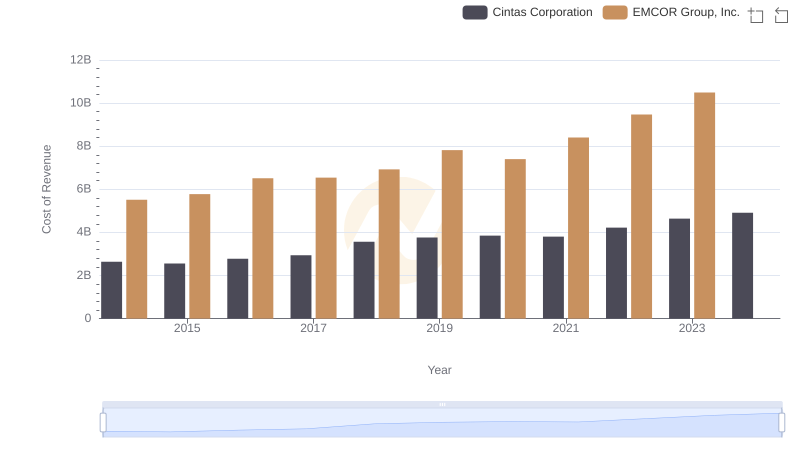
Comparing Cost of Revenue Efficiency: Cintas Corporation vs EMCOR Group, Inc.
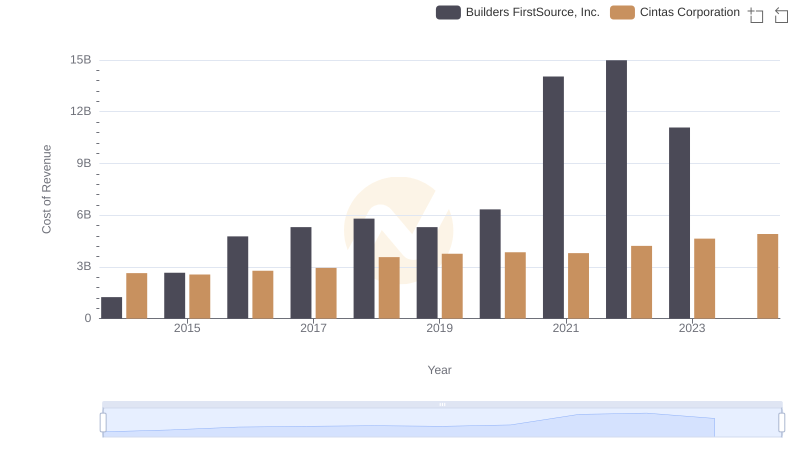
Comparing Cost of Revenue Efficiency: Cintas Corporation vs Builders FirstSource, Inc.
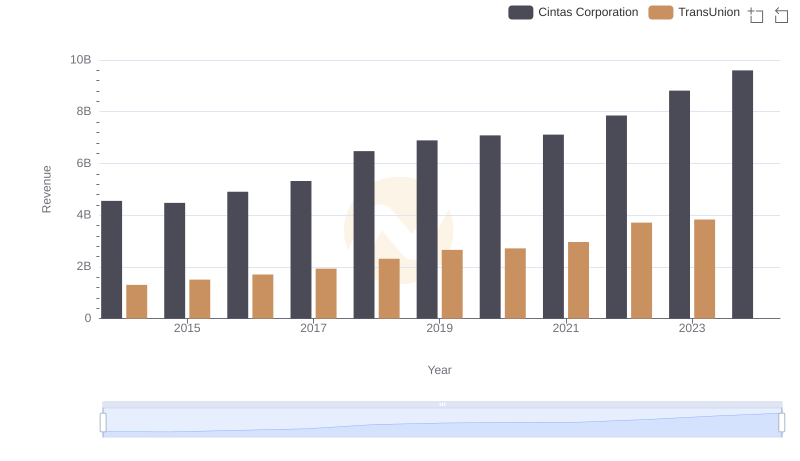
Cintas Corporation or TransUnion: Who Leads in Yearly Revenue?
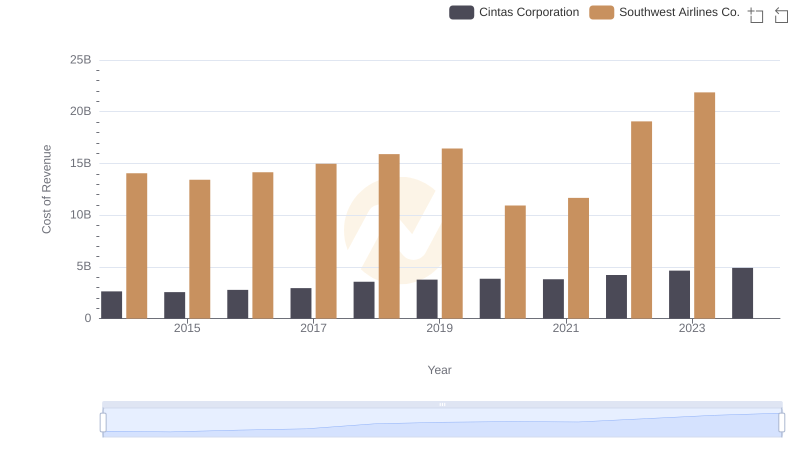
Comparing Cost of Revenue Efficiency: Cintas Corporation vs Southwest Airlines Co.
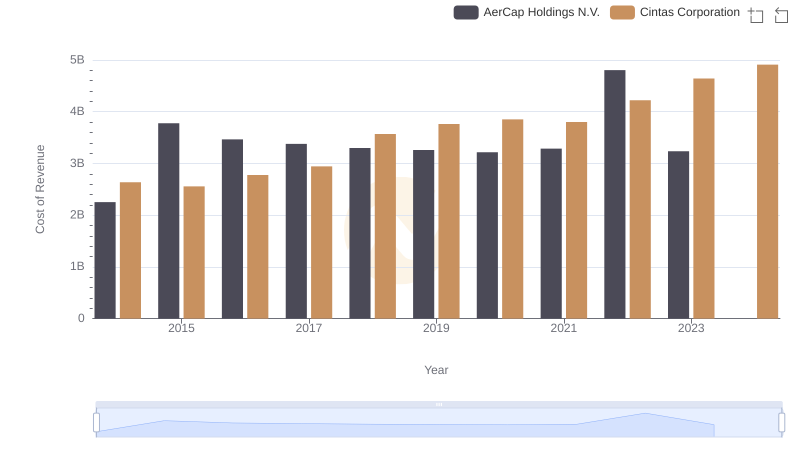
Cost of Revenue Trends: Cintas Corporation vs AerCap Holdings N.V.
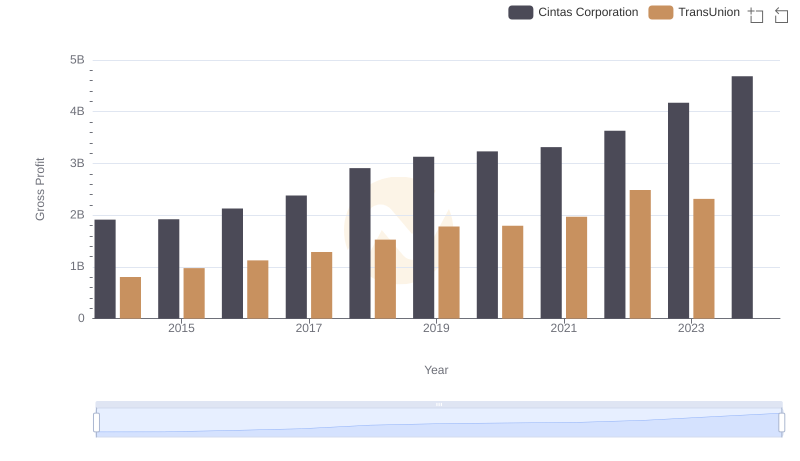
Gross Profit Trends Compared: Cintas Corporation vs TransUnion
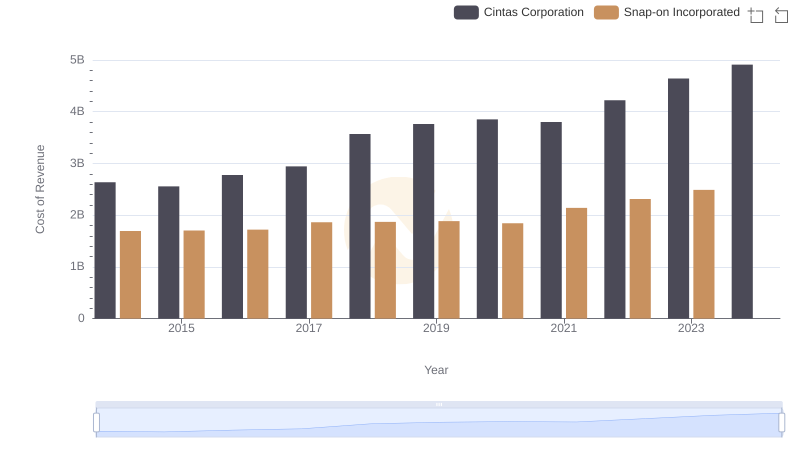
Analyzing Cost of Revenue: Cintas Corporation and Snap-on Incorporated
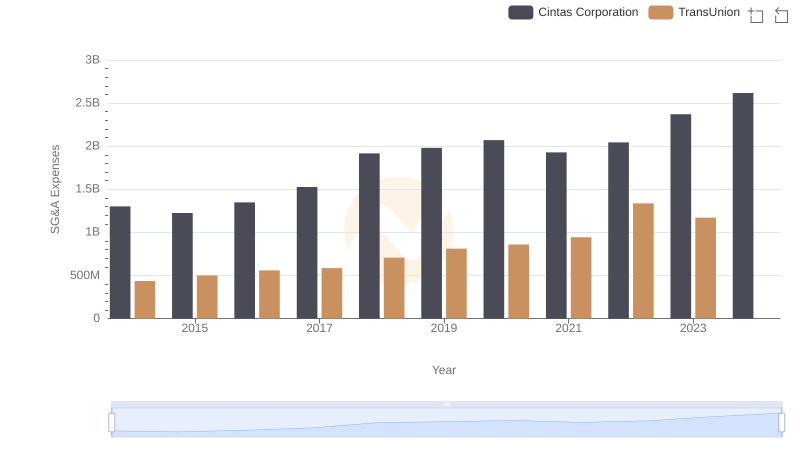
Who Optimizes SG&A Costs Better? Cintas Corporation or TransUnion
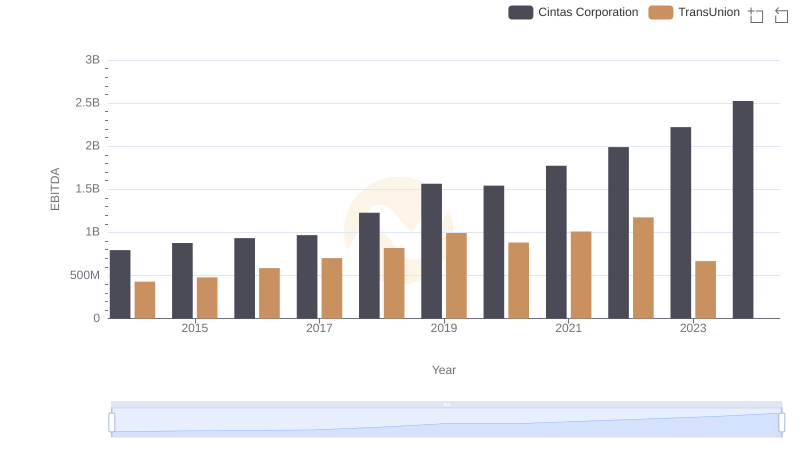
EBITDA Performance Review: Cintas Corporation vs TransUnion