| __timestamp | Builders FirstSource, Inc. | Cintas Corporation |
|---|---|---|
| Wednesday, January 1, 2014 | 306508000 | 1302752000 |
| Thursday, January 1, 2015 | 810841000 | 1224930000 |
| Friday, January 1, 2016 | 1360412000 | 1348122000 |
| Sunday, January 1, 2017 | 1442288000 | 1527380000 |
| Monday, January 1, 2018 | 1553972000 | 1916792000 |
| Tuesday, January 1, 2019 | 1584523000 | 1980644000 |
| Wednesday, January 1, 2020 | 1678730000 | 2071052000 |
| Friday, January 1, 2021 | 3463532000 | 1929159000 |
| Saturday, January 1, 2022 | 3974173000 | 2044876000 |
| Sunday, January 1, 2023 | 3836015000 | 2370704000 |
| Monday, January 1, 2024 | 2617783000 |
Unlocking the unknown
In the ever-evolving landscape of corporate finance, understanding the nuances of Selling, General, and Administrative (SG&A) expenses is crucial for investors and analysts alike. Over the past decade, Cintas Corporation and Builders FirstSource, Inc. have demonstrated distinct trajectories in their SG&A expenditures.
From 2014 to 2023, Builders FirstSource, Inc. saw a staggering increase of over 1,150% in SG&A expenses, peaking in 2022. This surge reflects the company's aggressive expansion and operational scaling. In contrast, Cintas Corporation exhibited a more stable growth pattern, with a 95% increase over the same period, highlighting its strategic cost management.
Interestingly, 2021 marked a pivotal year where Builders FirstSource's SG&A expenses surpassed Cintas Corporation's, indicating a shift in financial dynamics. As we look to 2024, Cintas continues to project growth, while Builders FirstSource's data remains incomplete, leaving room for speculation.
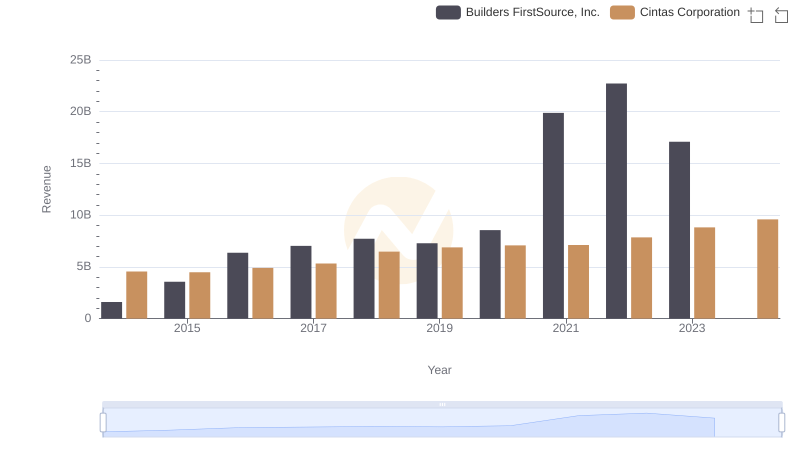
Cintas Corporation vs Builders FirstSource, Inc.: Annual Revenue Growth Compared
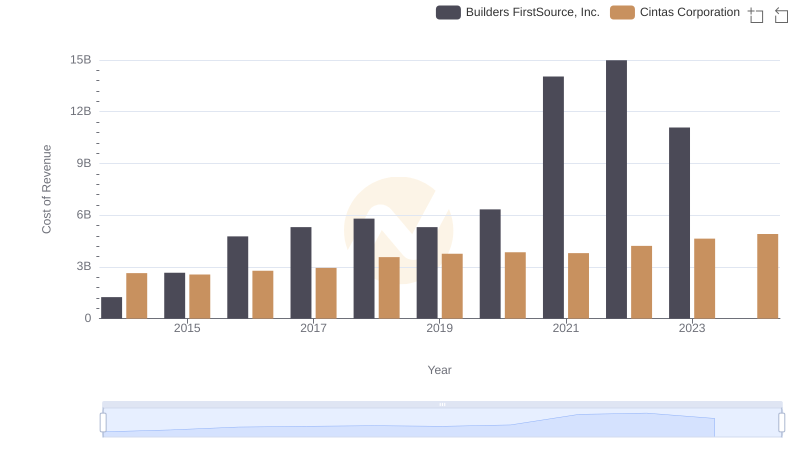
Comparing Cost of Revenue Efficiency: Cintas Corporation vs Builders FirstSource, Inc.
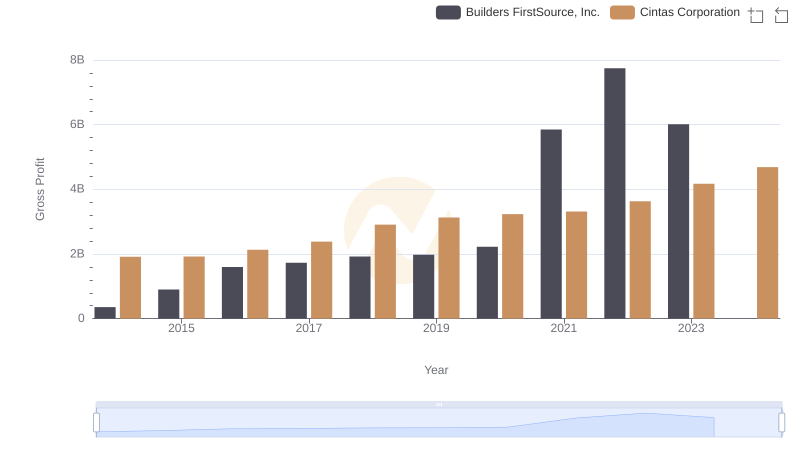
Key Insights on Gross Profit: Cintas Corporation vs Builders FirstSource, Inc.
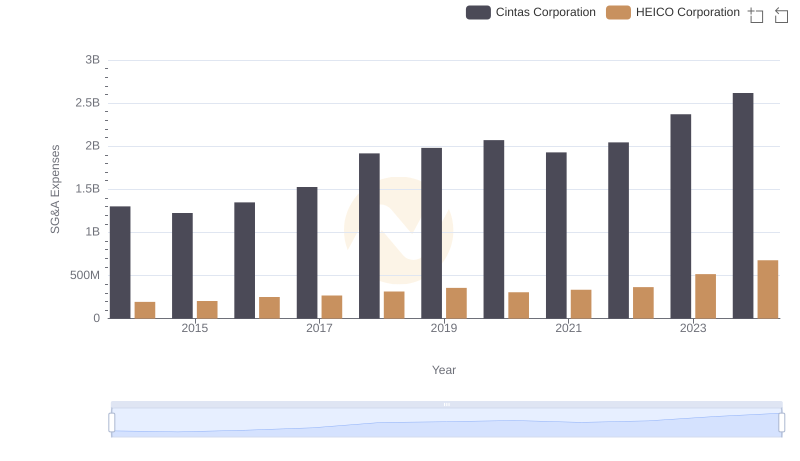
Cintas Corporation vs HEICO Corporation: SG&A Expense Trends
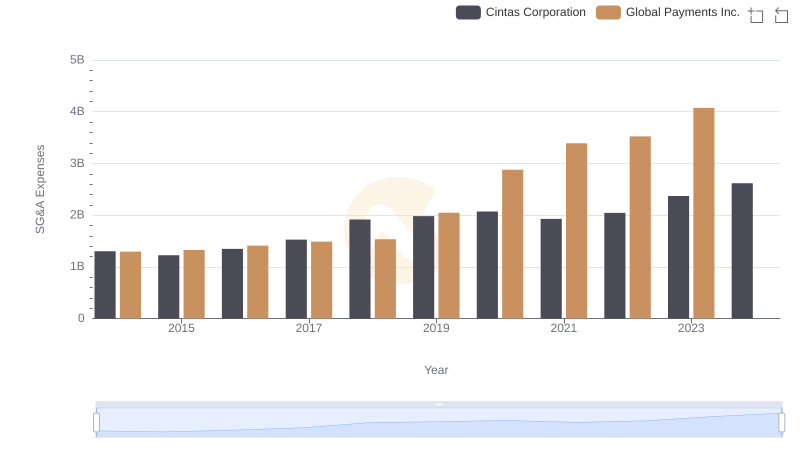
Cintas Corporation and Global Payments Inc.: SG&A Spending Patterns Compared
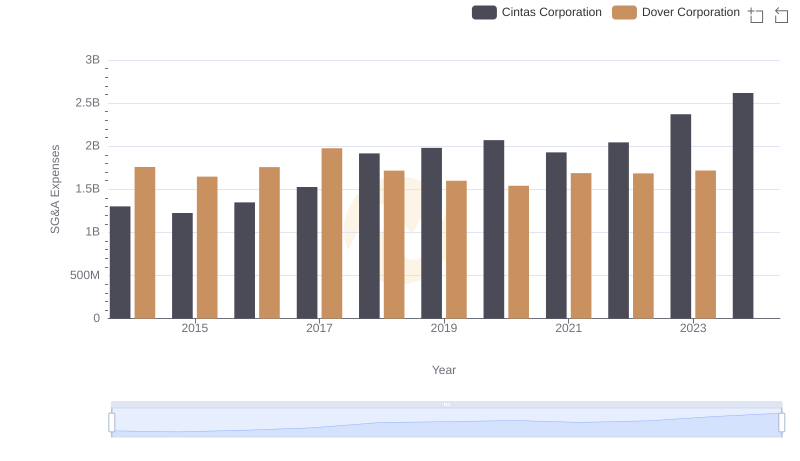
Cintas Corporation and Dover Corporation: SG&A Spending Patterns Compared
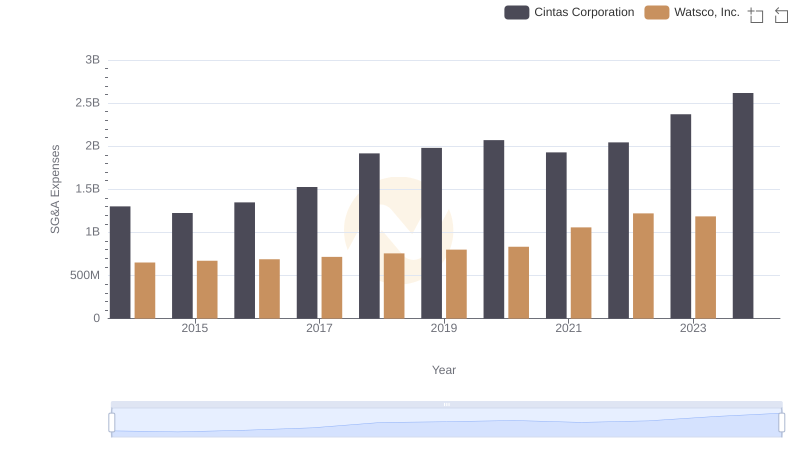
Cintas Corporation vs Watsco, Inc.: SG&A Expense Trends
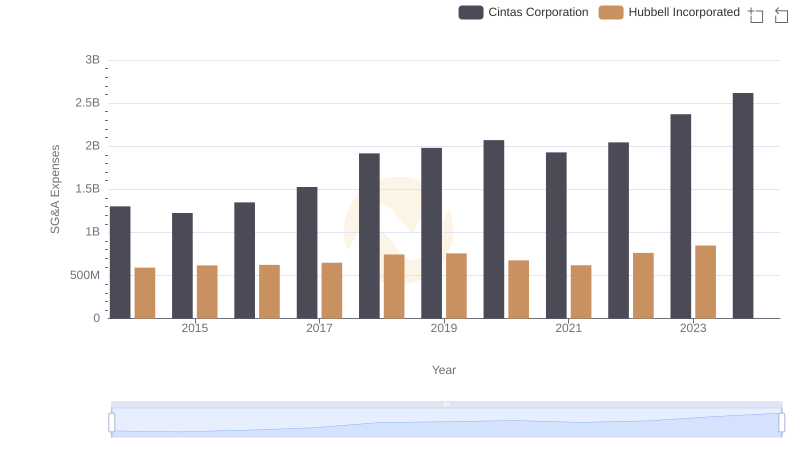
SG&A Efficiency Analysis: Comparing Cintas Corporation and Hubbell Incorporated
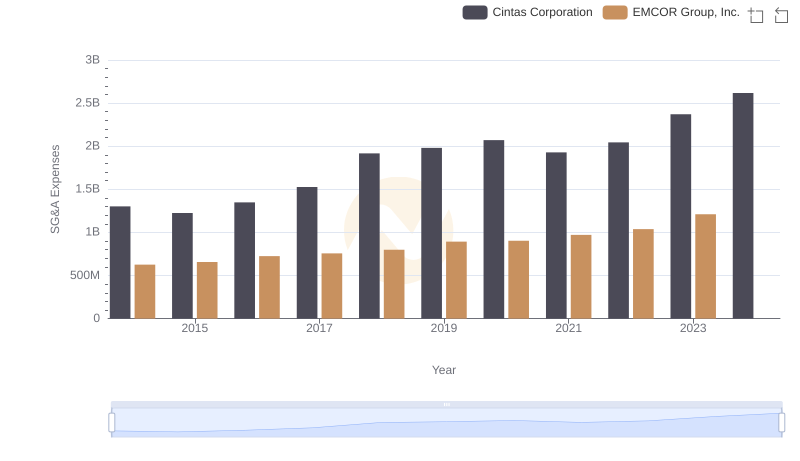
Comparing SG&A Expenses: Cintas Corporation vs EMCOR Group, Inc. Trends and Insights
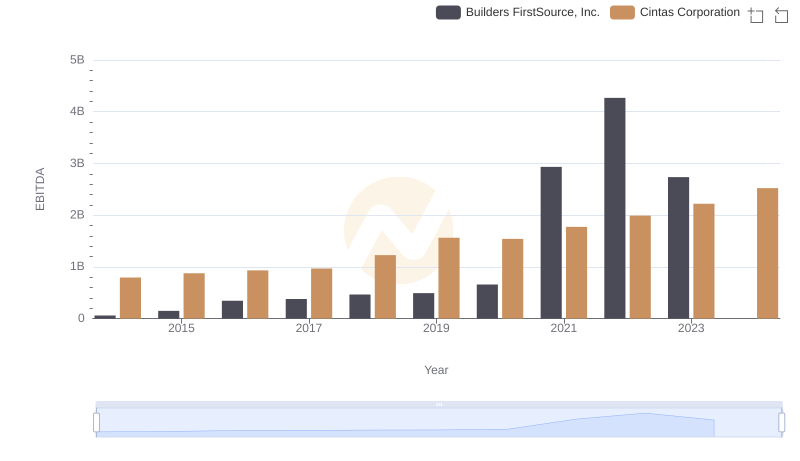
A Side-by-Side Analysis of EBITDA: Cintas Corporation and Builders FirstSource, Inc.
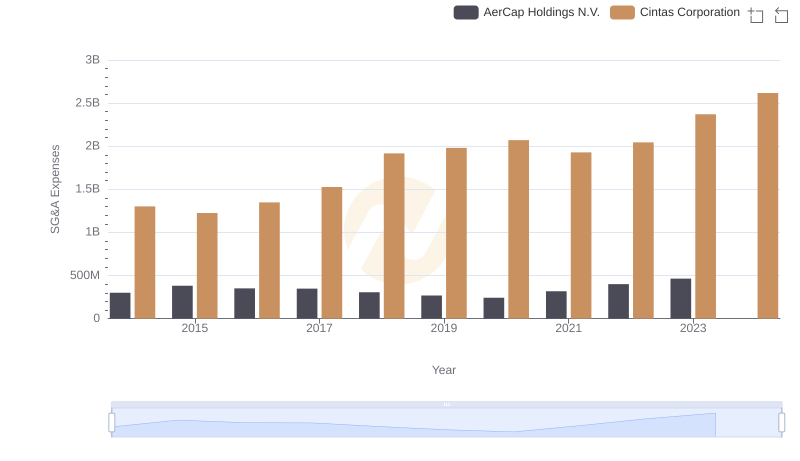
Selling, General, and Administrative Costs: Cintas Corporation vs AerCap Holdings N.V.