| __timestamp | Cintas Corporation | Stanley Black & Decker, Inc. |
|---|---|---|
| Wednesday, January 1, 2014 | 1302752000 | 2595900000 |
| Thursday, January 1, 2015 | 1224930000 | 2486400000 |
| Friday, January 1, 2016 | 1348122000 | 2623900000 |
| Sunday, January 1, 2017 | 1527380000 | 2980100000 |
| Monday, January 1, 2018 | 1916792000 | 3171700000 |
| Tuesday, January 1, 2019 | 1980644000 | 3041000000 |
| Wednesday, January 1, 2020 | 2071052000 | 3089600000 |
| Friday, January 1, 2021 | 1929159000 | 3240400000 |
| Saturday, January 1, 2022 | 2044876000 | 3370000000 |
| Sunday, January 1, 2023 | 2370704000 | 2829300000 |
| Monday, January 1, 2024 | 2617783000 | 3310500000 |
Unleashing insights
In the ever-evolving landscape of corporate finance, understanding operational costs is crucial. This analysis delves into the Selling, General, and Administrative (SG&A) expenses of two industry giants: Cintas Corporation and Stanley Black & Decker, Inc., from 2014 to 2023.
Cintas Corporation has shown a remarkable upward trend, with SG&A expenses increasing by approximately 100% over the decade, peaking at $2.62 billion in 2024. This growth reflects Cintas's strategic investments in expanding its service offerings and market reach. In contrast, Stanley Black & Decker's SG&A expenses have remained relatively stable, with a slight increase of around 30% until 2022, before a notable dip in 2023. This fluctuation could indicate a strategic shift or cost optimization efforts.
The data highlights the dynamic nature of operational strategies and their impact on financial health, offering valuable insights for investors and analysts alike.
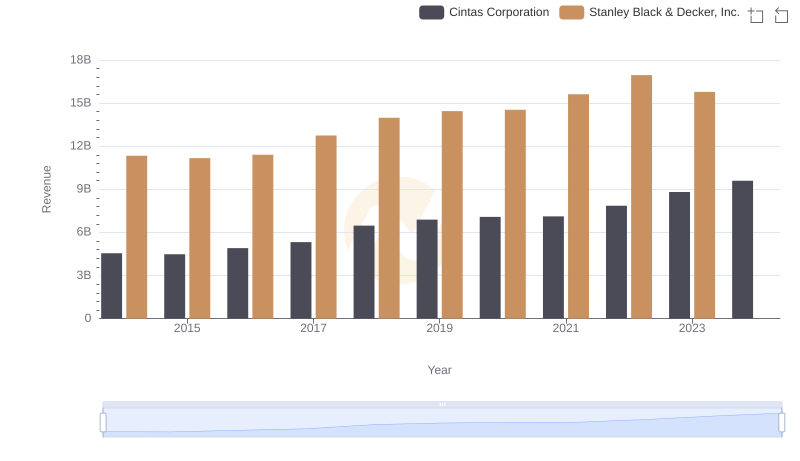
Cintas Corporation or Stanley Black & Decker, Inc.: Who Leads in Yearly Revenue?

Cost of Revenue: Key Insights for Cintas Corporation and Stanley Black & Decker, Inc.
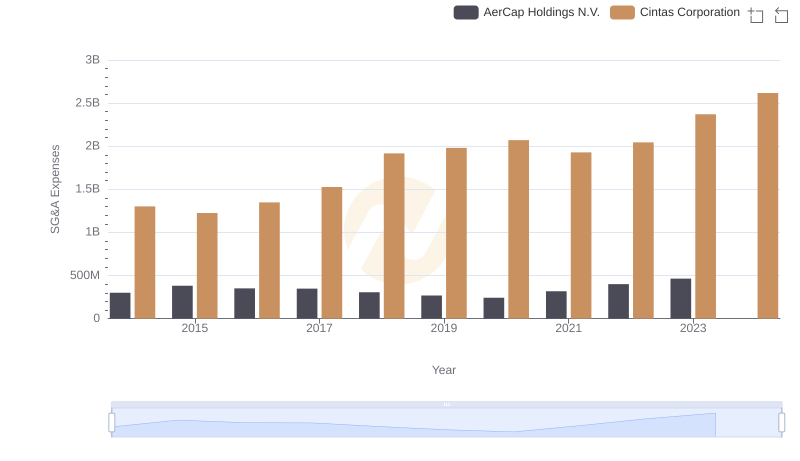
Selling, General, and Administrative Costs: Cintas Corporation vs AerCap Holdings N.V.

Key Insights on Gross Profit: Cintas Corporation vs Stanley Black & Decker, Inc.
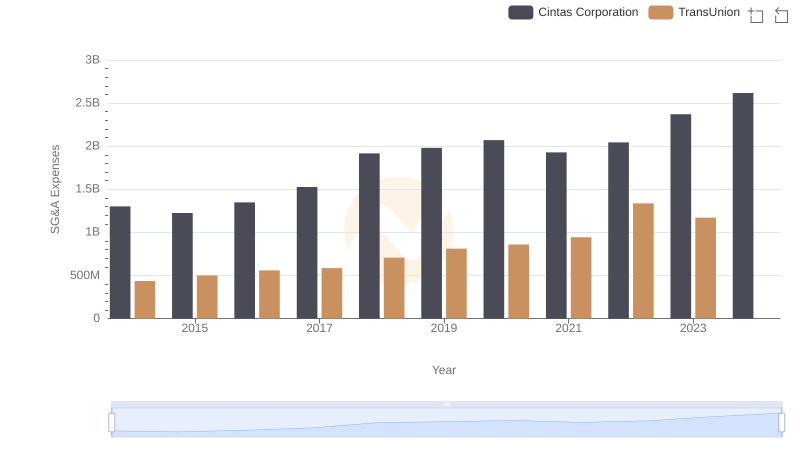
Who Optimizes SG&A Costs Better? Cintas Corporation or TransUnion
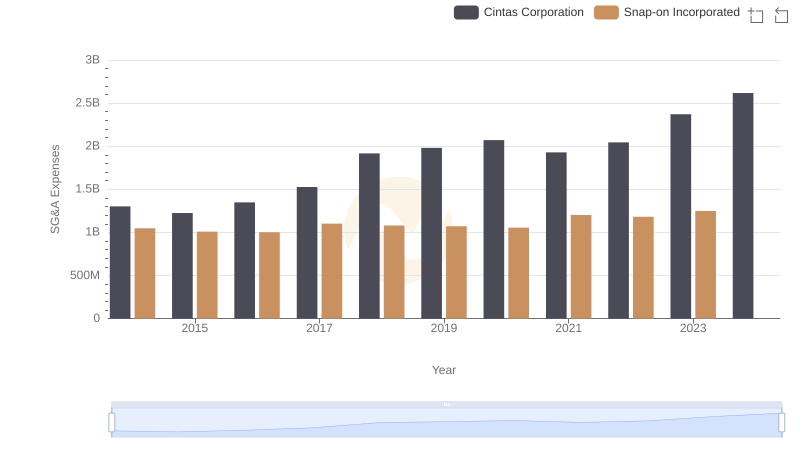
Selling, General, and Administrative Costs: Cintas Corporation vs Snap-on Incorporated
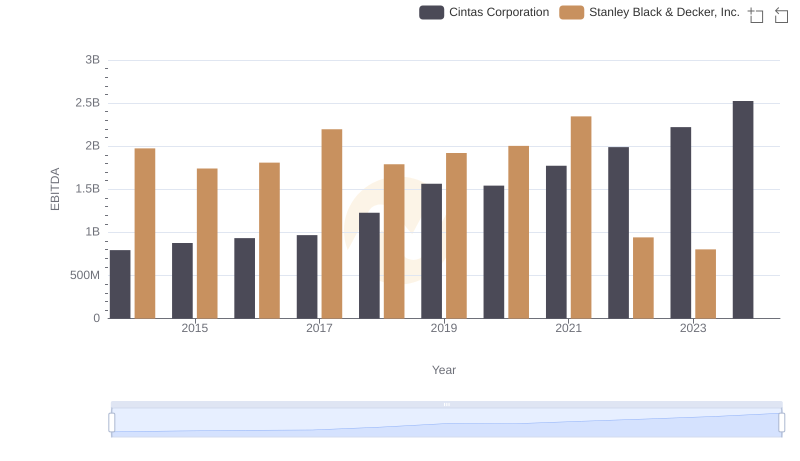
Cintas Corporation vs Stanley Black & Decker, Inc.: In-Depth EBITDA Performance Comparison

Breaking Down Revenue Trends: Cintas Corporation vs Stanley Black & Decker, Inc.
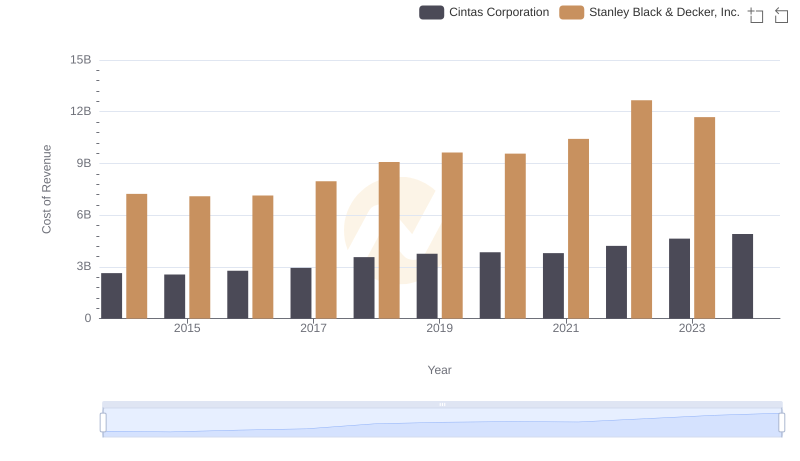
Analyzing Cost of Revenue: Cintas Corporation and Stanley Black & Decker, Inc.
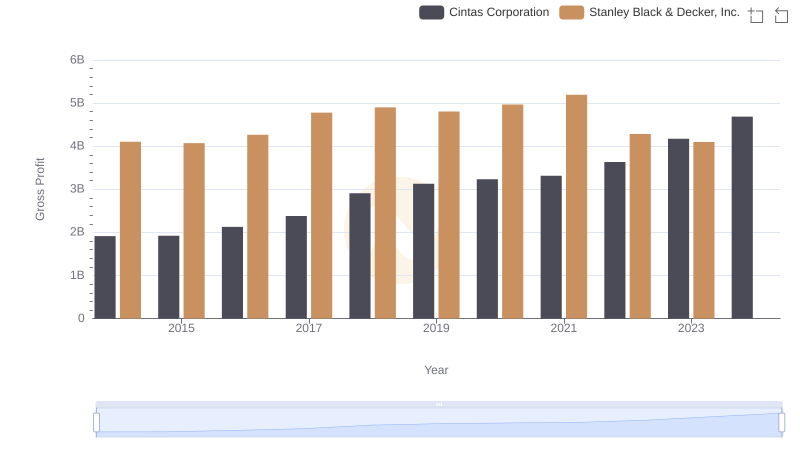
Key Insights on Gross Profit: Cintas Corporation vs Stanley Black & Decker, Inc.
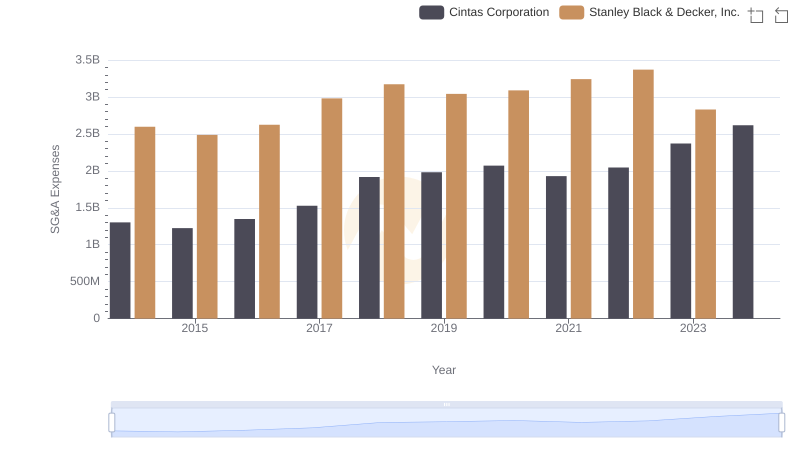
Cintas Corporation or Stanley Black & Decker, Inc.: Who Manages SG&A Costs Better?

Comprehensive EBITDA Comparison: Cintas Corporation vs Stanley Black & Decker, Inc.