| __timestamp | Cintas Corporation | Snap-on Incorporated |
|---|---|---|
| Wednesday, January 1, 2014 | 1302752000 | 1047900000 |
| Thursday, January 1, 2015 | 1224930000 | 1009100000 |
| Friday, January 1, 2016 | 1348122000 | 1001400000 |
| Sunday, January 1, 2017 | 1527380000 | 1101300000 |
| Monday, January 1, 2018 | 1916792000 | 1080700000 |
| Tuesday, January 1, 2019 | 1980644000 | 1071500000 |
| Wednesday, January 1, 2020 | 2071052000 | 1054800000 |
| Friday, January 1, 2021 | 1929159000 | 1202300000 |
| Saturday, January 1, 2022 | 2044876000 | 1181200000 |
| Sunday, January 1, 2023 | 2370704000 | 1249000000 |
| Monday, January 1, 2024 | 2617783000 | 0 |
Unlocking the unknown
In the world of corporate finance, Selling, General, and Administrative (SG&A) expenses are a critical measure of a company's operational efficiency. This chart compares the SG&A expenses of Cintas Corporation and Snap-on Incorporated from 2014 to 2023.
Cintas Corporation has shown a remarkable upward trend in its SG&A expenses, increasing by approximately 100% over the decade. Starting at around $1.3 billion in 2014, the expenses surged to over $2.6 billion by 2023. This growth reflects Cintas's expanding operations and market presence.
Snap-on Incorporated, on the other hand, maintained a more stable trajectory. Its SG&A expenses hovered around the $1 billion mark, with a modest increase to $1.25 billion in 2023. This stability suggests a consistent operational strategy.
While Cintas's data extends to 2024, Snap-on's figures for that year are unavailable, leaving room for speculation on future trends.
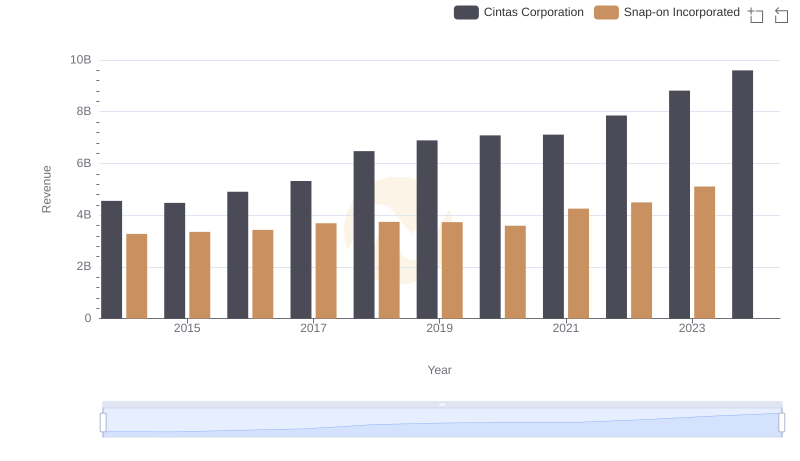
Comparing Revenue Performance: Cintas Corporation or Snap-on Incorporated?
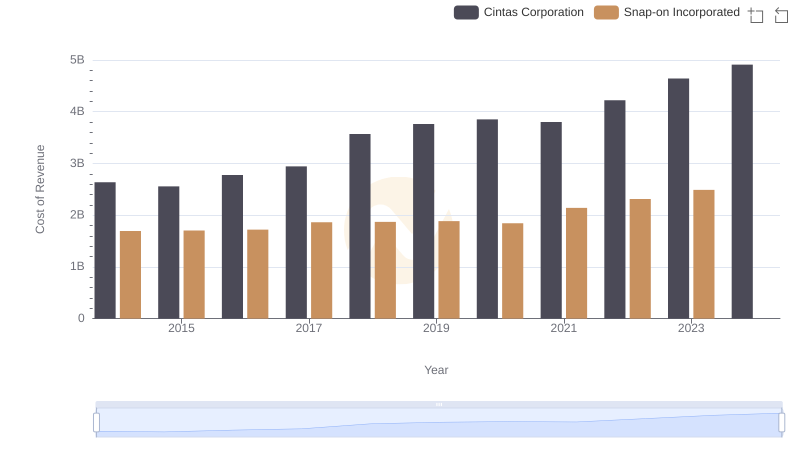
Analyzing Cost of Revenue: Cintas Corporation and Snap-on Incorporated
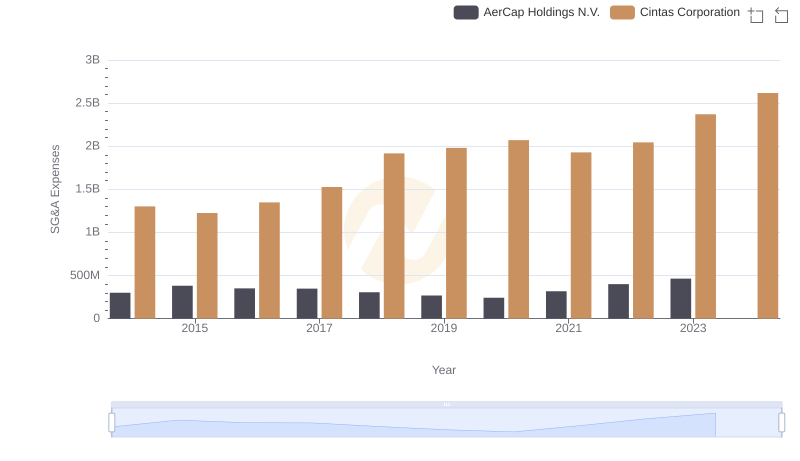
Selling, General, and Administrative Costs: Cintas Corporation vs AerCap Holdings N.V.
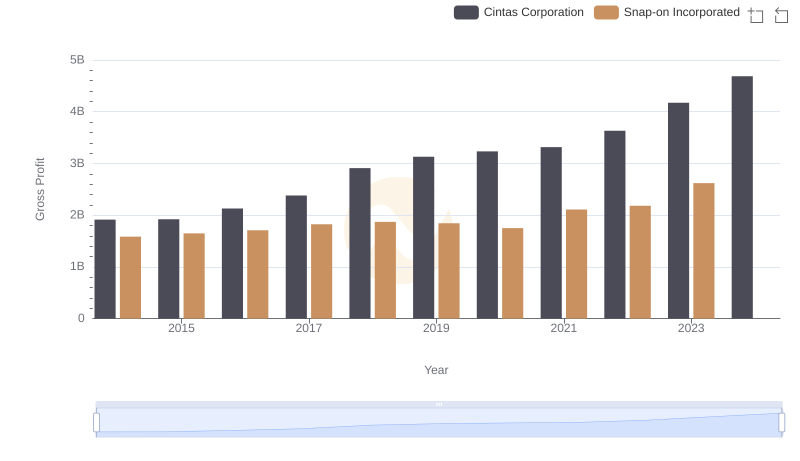
Gross Profit Trends Compared: Cintas Corporation vs Snap-on Incorporated
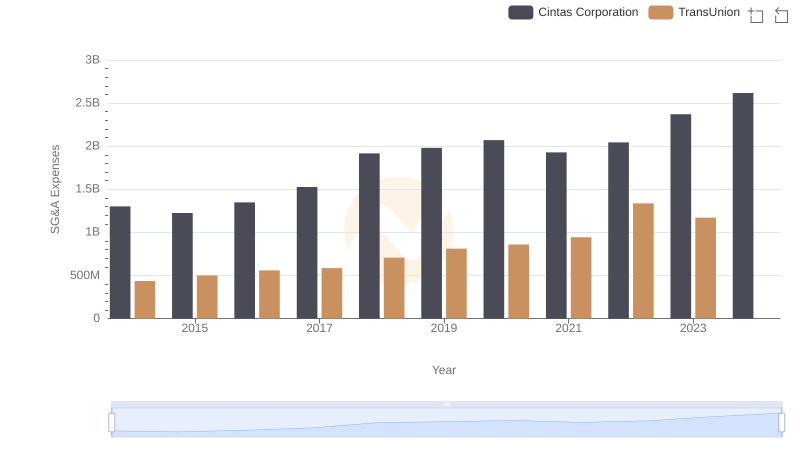
Who Optimizes SG&A Costs Better? Cintas Corporation or TransUnion
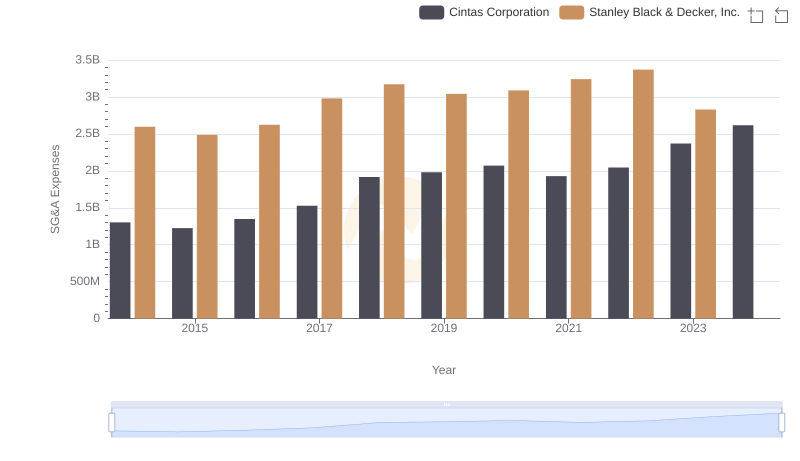
Operational Costs Compared: SG&A Analysis of Cintas Corporation and Stanley Black & Decker, Inc.
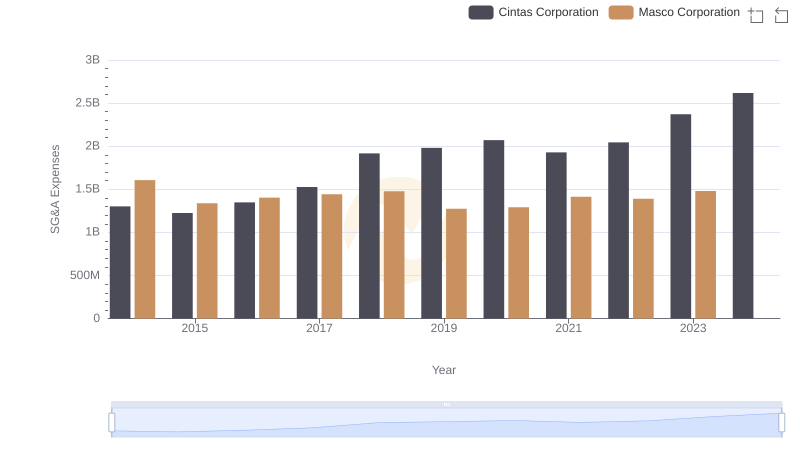
Cintas Corporation vs Masco Corporation: SG&A Expense Trends
Comparing SG&A Expenses: Cintas Corporation vs J.B. Hunt Transport Services, Inc. Trends and Insights
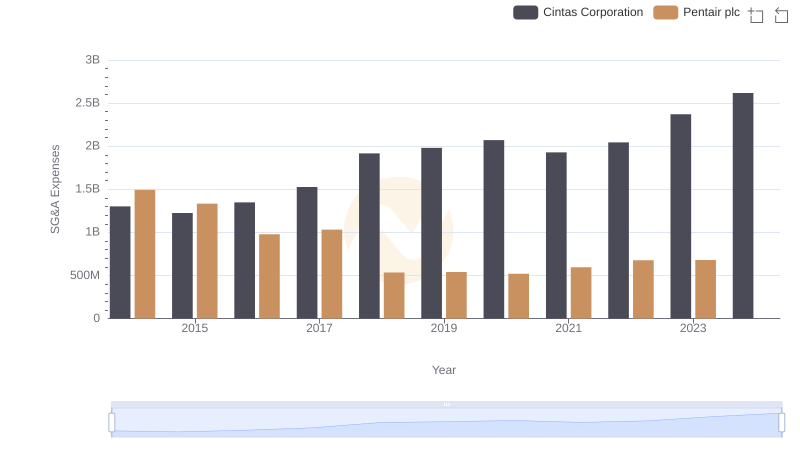
Breaking Down SG&A Expenses: Cintas Corporation vs Pentair plc
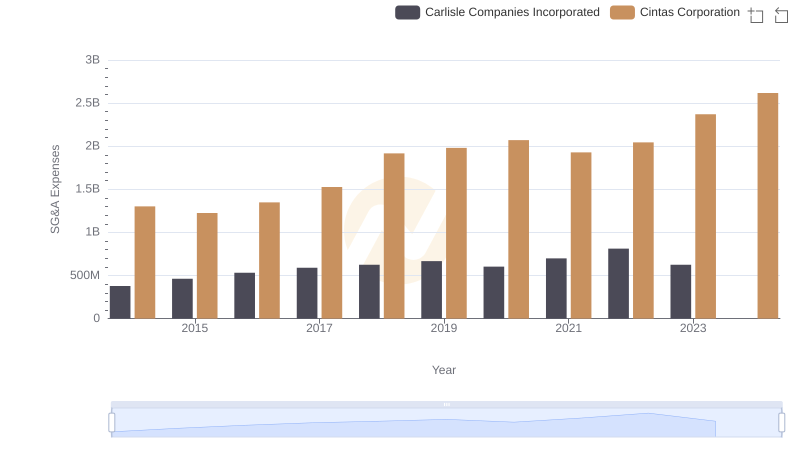
Who Optimizes SG&A Costs Better? Cintas Corporation or Carlisle Companies Incorporated
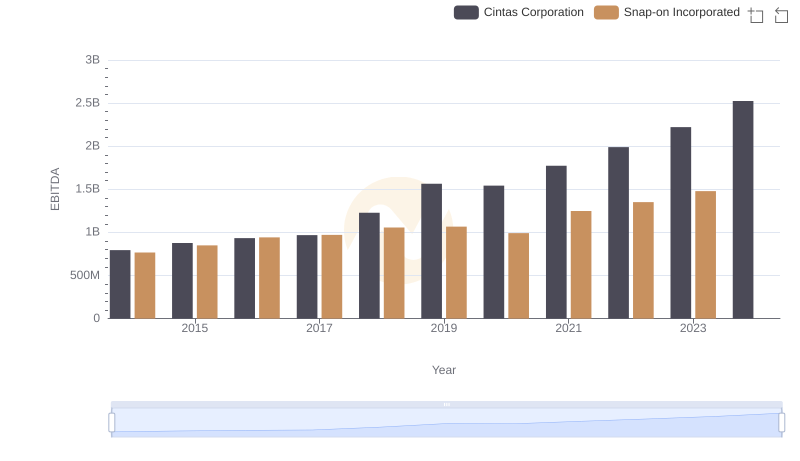
EBITDA Metrics Evaluated: Cintas Corporation vs Snap-on Incorporated
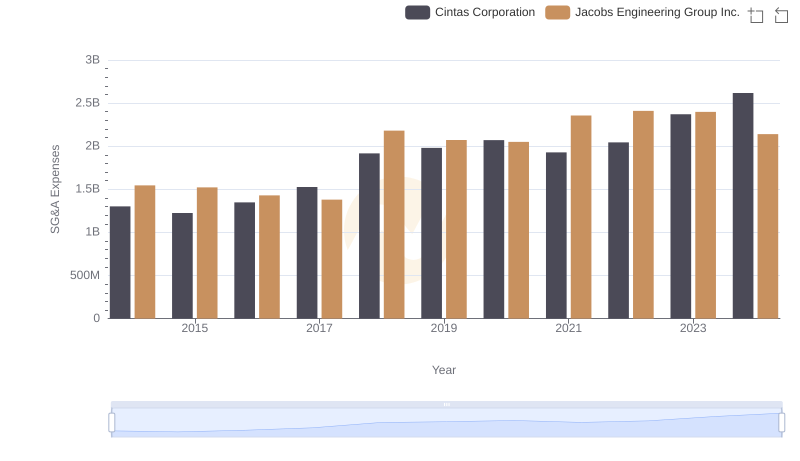
Cost Management Insights: SG&A Expenses for Cintas Corporation and Jacobs Engineering Group Inc.