| __timestamp | Cintas Corporation | EMCOR Group, Inc. |
|---|---|---|
| Wednesday, January 1, 2014 | 1302752000 | 626478000 |
| Thursday, January 1, 2015 | 1224930000 | 656573000 |
| Friday, January 1, 2016 | 1348122000 | 725538000 |
| Sunday, January 1, 2017 | 1527380000 | 757062000 |
| Monday, January 1, 2018 | 1916792000 | 799157000 |
| Tuesday, January 1, 2019 | 1980644000 | 893453000 |
| Wednesday, January 1, 2020 | 2071052000 | 903584000 |
| Friday, January 1, 2021 | 1929159000 | 970937000 |
| Saturday, January 1, 2022 | 2044876000 | 1038717000 |
| Sunday, January 1, 2023 | 2370704000 | 1211233000 |
| Monday, January 1, 2024 | 2617783000 |
Unveiling the hidden dimensions of data
In the competitive landscape of corporate America, understanding the financial dynamics of industry leaders is crucial. Cintas Corporation and EMCOR Group, Inc., two stalwarts in their respective fields, have shown intriguing trends in their Selling, General, and Administrative (SG&A) expenses over the past decade. From 2014 to 2023, Cintas Corporation's SG&A expenses surged by approximately 101%, reflecting its aggressive growth and expansion strategies. In contrast, EMCOR Group, Inc. experienced a more modest increase of around 93% during the same period.
The year 2023 marked a significant milestone, with Cintas's expenses reaching a peak, while EMCOR's data for 2024 remains elusive. This divergence highlights the varying strategic priorities and operational efficiencies of these corporations. As we look to the future, these trends offer valuable insights into the evolving business strategies of these industry titans.
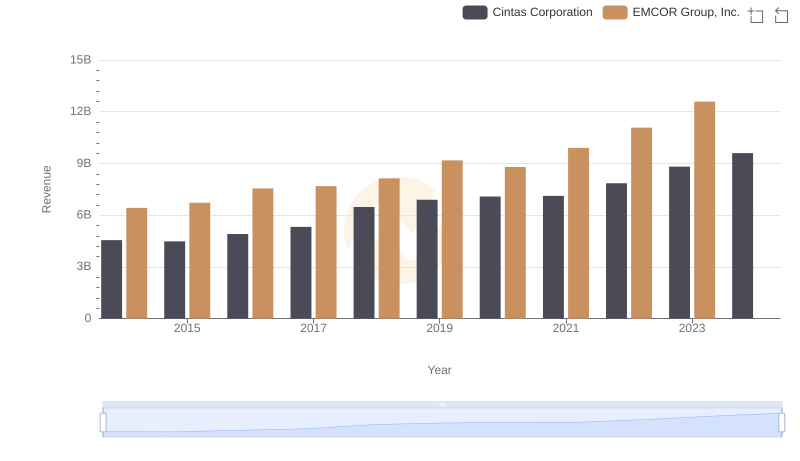
Cintas Corporation or EMCOR Group, Inc.: Who Leads in Yearly Revenue?
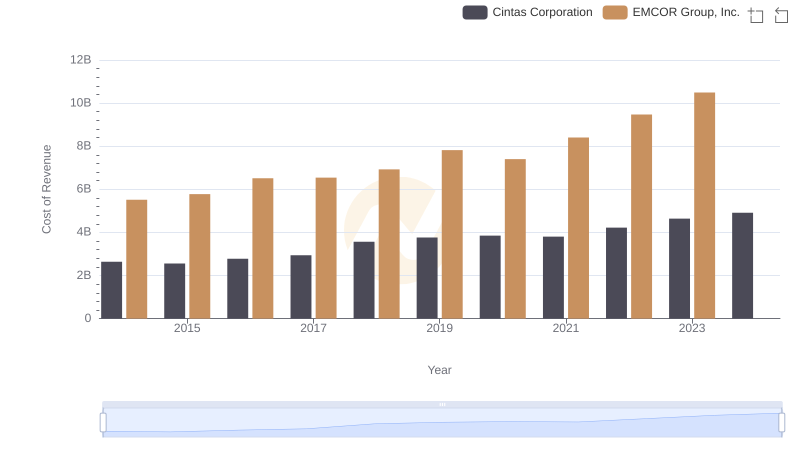
Comparing Cost of Revenue Efficiency: Cintas Corporation vs EMCOR Group, Inc.
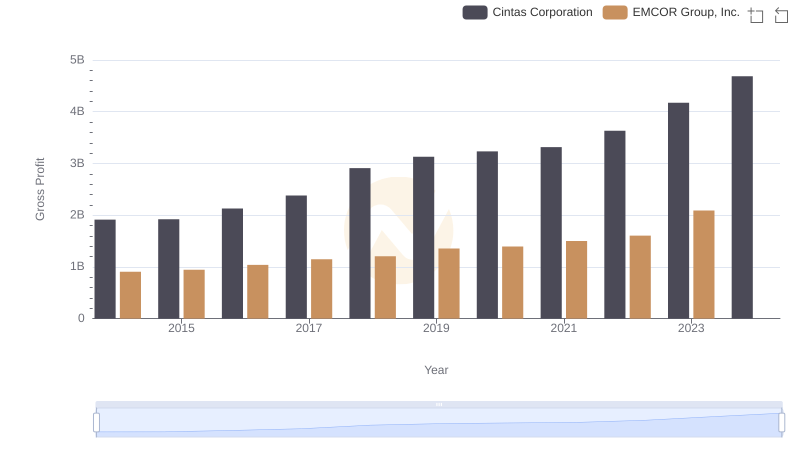
Gross Profit Trends Compared: Cintas Corporation vs EMCOR Group, Inc.
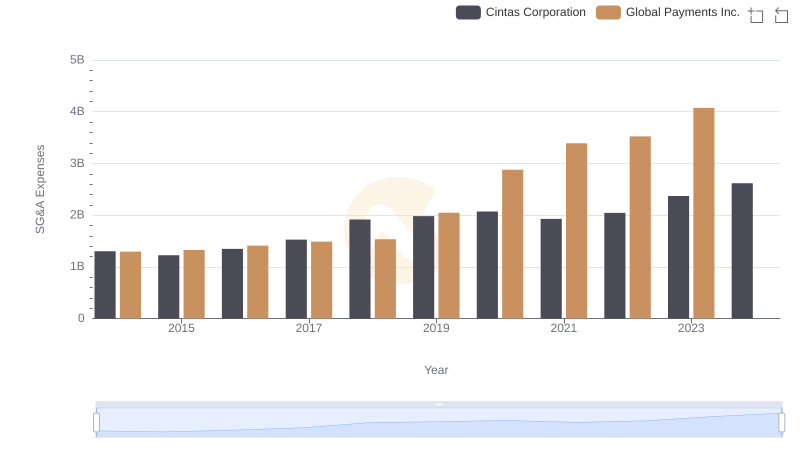
Cintas Corporation and Global Payments Inc.: SG&A Spending Patterns Compared
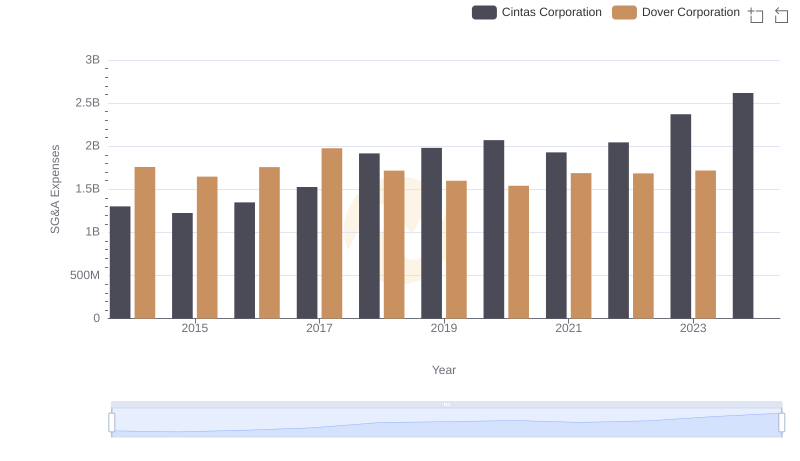
Cintas Corporation and Dover Corporation: SG&A Spending Patterns Compared
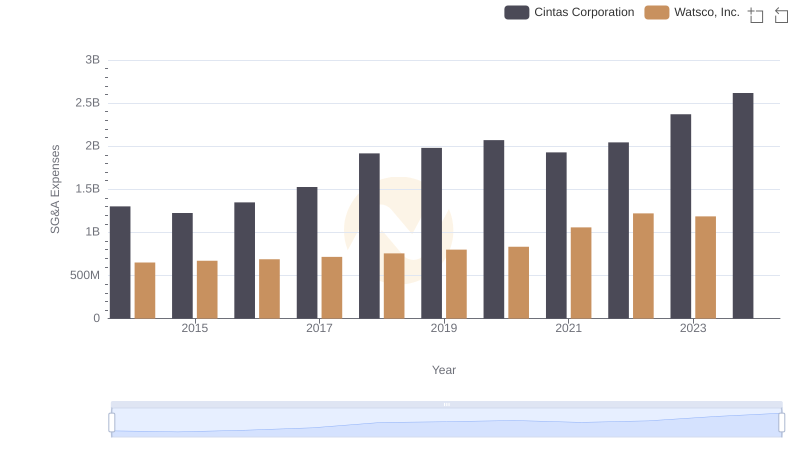
Cintas Corporation vs Watsco, Inc.: SG&A Expense Trends
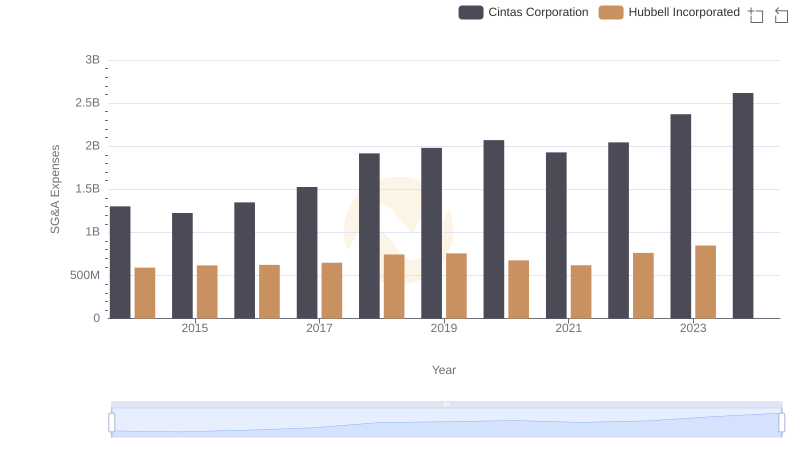
SG&A Efficiency Analysis: Comparing Cintas Corporation and Hubbell Incorporated
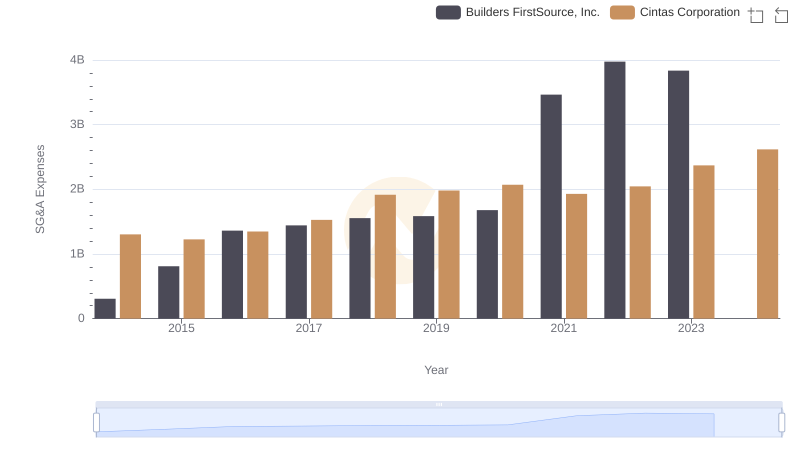
Breaking Down SG&A Expenses: Cintas Corporation vs Builders FirstSource, Inc.
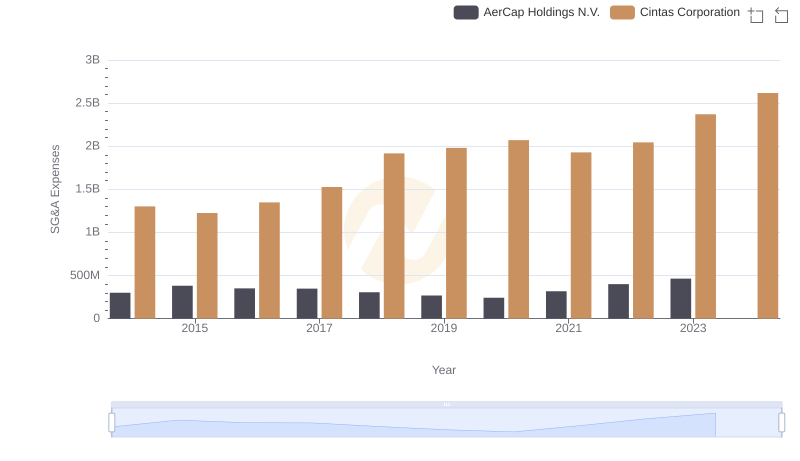
Selling, General, and Administrative Costs: Cintas Corporation vs AerCap Holdings N.V.
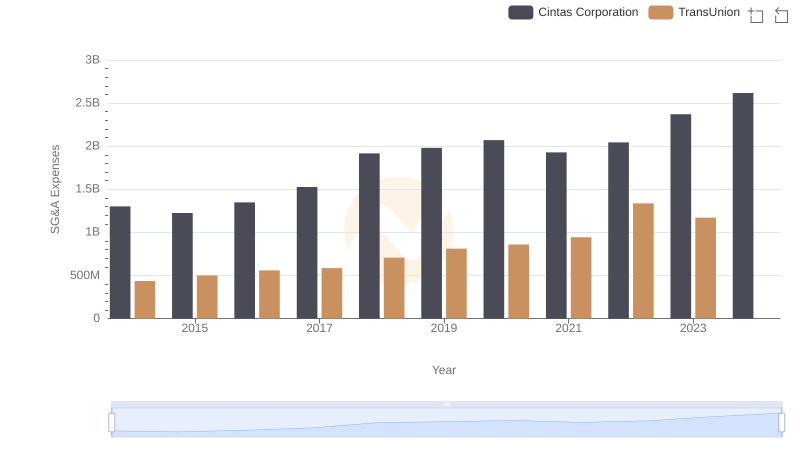
Who Optimizes SG&A Costs Better? Cintas Corporation or TransUnion
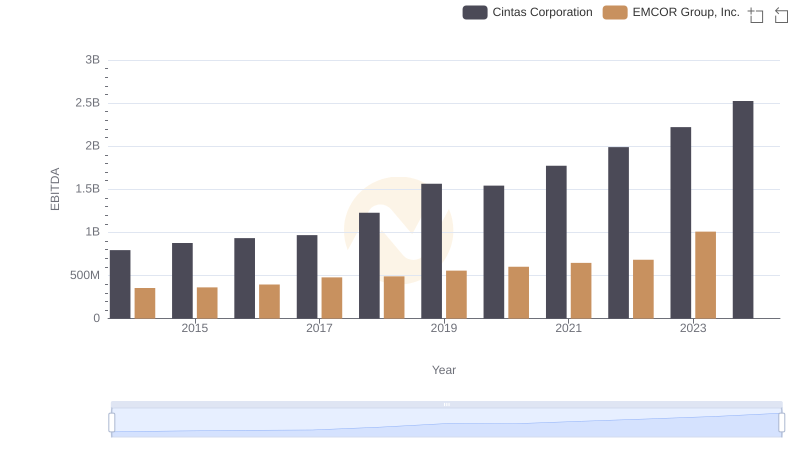
EBITDA Analysis: Evaluating Cintas Corporation Against EMCOR Group, Inc.