| __timestamp | Cintas Corporation | TransUnion |
|---|---|---|
| Wednesday, January 1, 2014 | 4551812000 | 1304700000 |
| Thursday, January 1, 2015 | 4476886000 | 1506800000 |
| Friday, January 1, 2016 | 4905458000 | 1704900000 |
| Sunday, January 1, 2017 | 5323381000 | 1933800000 |
| Monday, January 1, 2018 | 6476632000 | 2317200000 |
| Tuesday, January 1, 2019 | 6892303000 | 2656100000 |
| Wednesday, January 1, 2020 | 7085120000 | 2716600000 |
| Friday, January 1, 2021 | 7116340000 | 2960200000 |
| Saturday, January 1, 2022 | 7854459000 | 3709900000 |
| Sunday, January 1, 2023 | 8815769000 | 3831200000 |
| Monday, January 1, 2024 | 9596615000 | 4183800000 |
Unleashing the power of data
In the competitive landscape of corporate America, Cintas Corporation and TransUnion have been vying for the top spot in yearly revenue since 2014. Cintas, a leader in uniform rental and facility services, has consistently outpaced TransUnion, a global information and insights company, in revenue growth. Over the past decade, Cintas has seen its revenue soar by approximately 111%, reaching nearly $9.6 billion in 2023. In contrast, TransUnion's revenue has grown by about 194%, peaking at $3.8 billion in the same year.
From 2014 to 2023, Cintas maintained a steady lead, with its revenue consistently doubling that of TransUnion. The data reveals a clear trend: Cintas's revenue growth has been robust, with a compound annual growth rate (CAGR) of around 8%. Meanwhile, TransUnion's CAGR stands at approximately 11%, showcasing its rapid expansion in the data-driven economy.
Interestingly, the data for 2024 is incomplete for TransUnion, leaving room for speculation about its future trajectory. Will TransUnion close the gap, or will Cintas continue to dominate? Only time will tell.
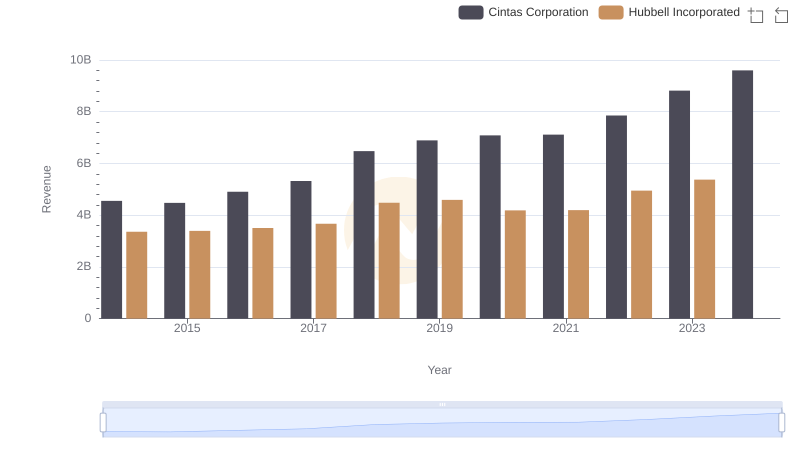
Comparing Revenue Performance: Cintas Corporation or Hubbell Incorporated?
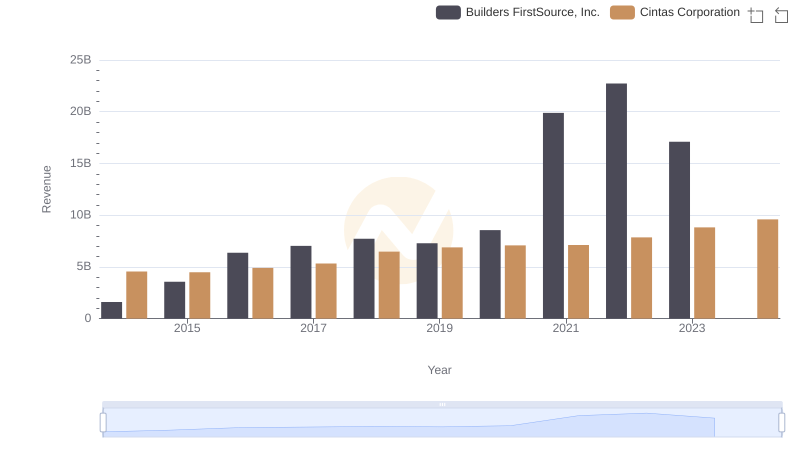
Cintas Corporation vs Builders FirstSource, Inc.: Annual Revenue Growth Compared
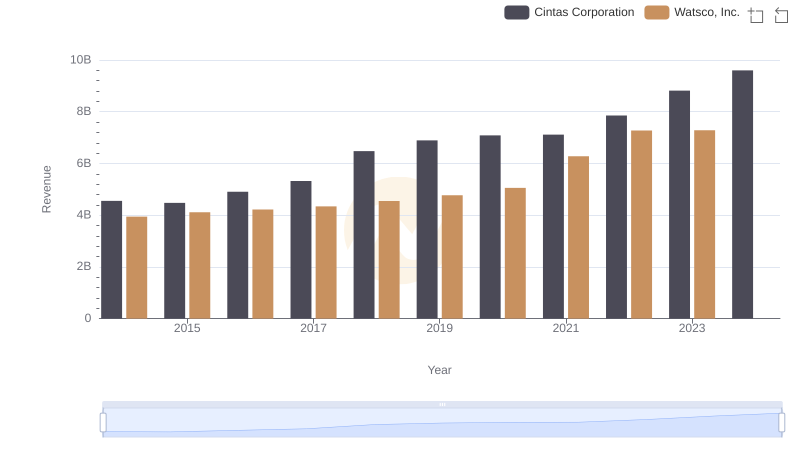
Cintas Corporation vs Watsco, Inc.: Examining Key Revenue Metrics
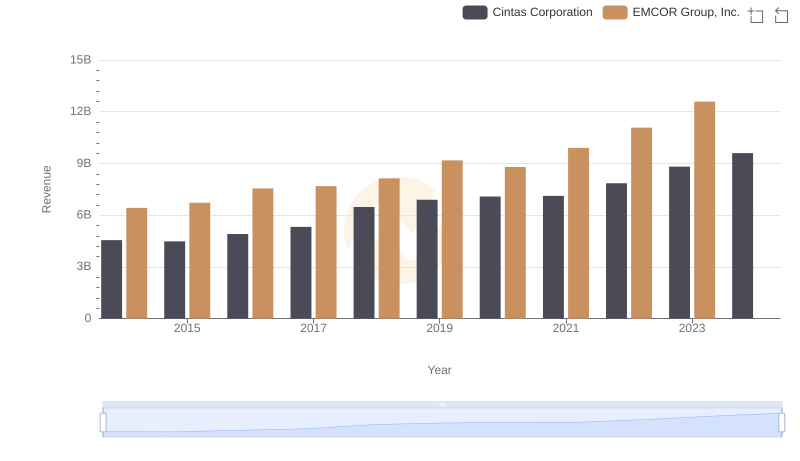
Cintas Corporation or EMCOR Group, Inc.: Who Leads in Yearly Revenue?
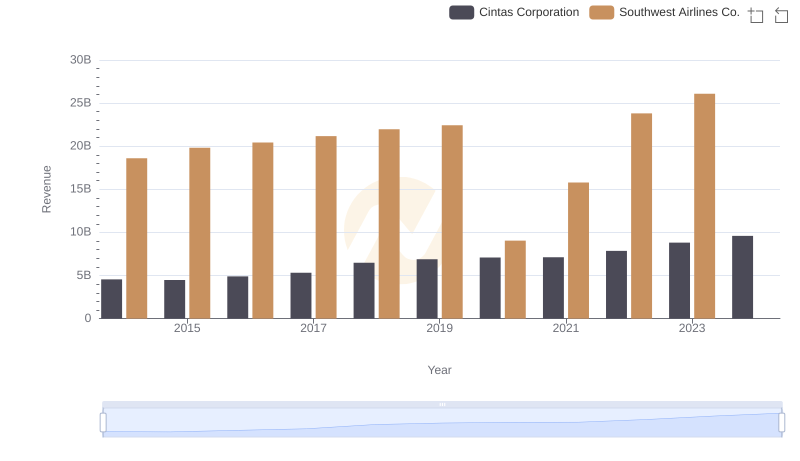
Annual Revenue Comparison: Cintas Corporation vs Southwest Airlines Co.
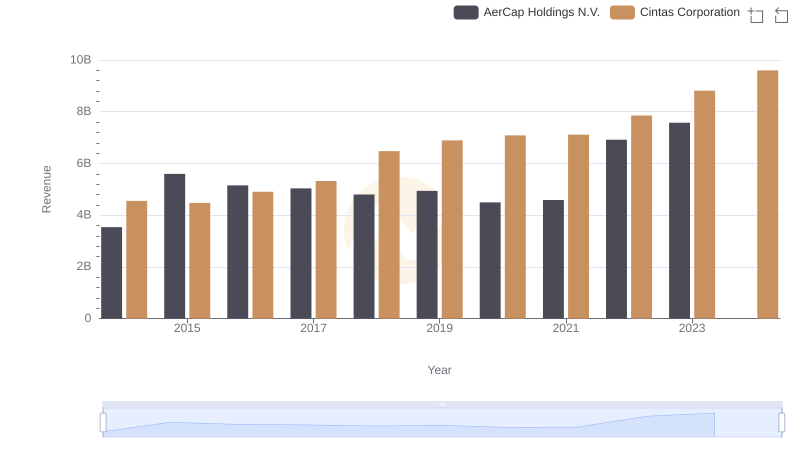
Annual Revenue Comparison: Cintas Corporation vs AerCap Holdings N.V.
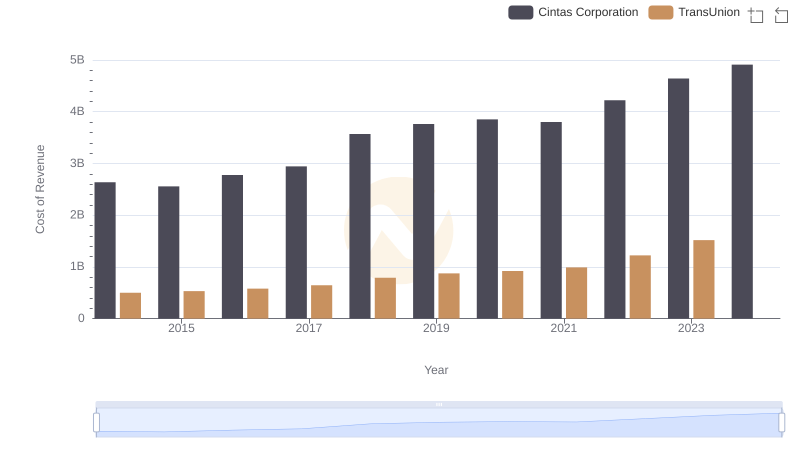
Cost of Revenue Trends: Cintas Corporation vs TransUnion
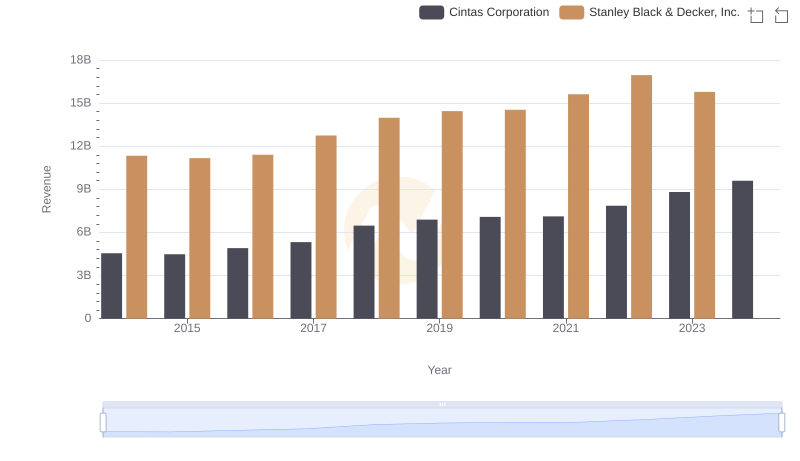
Cintas Corporation or Stanley Black & Decker, Inc.: Who Leads in Yearly Revenue?
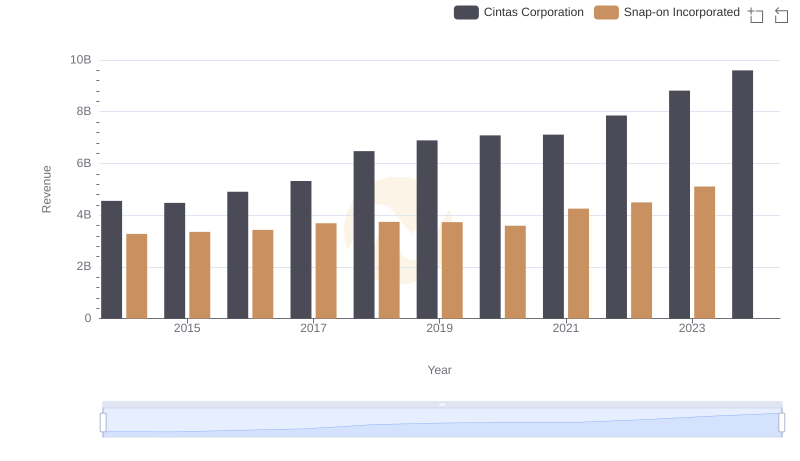
Comparing Revenue Performance: Cintas Corporation or Snap-on Incorporated?
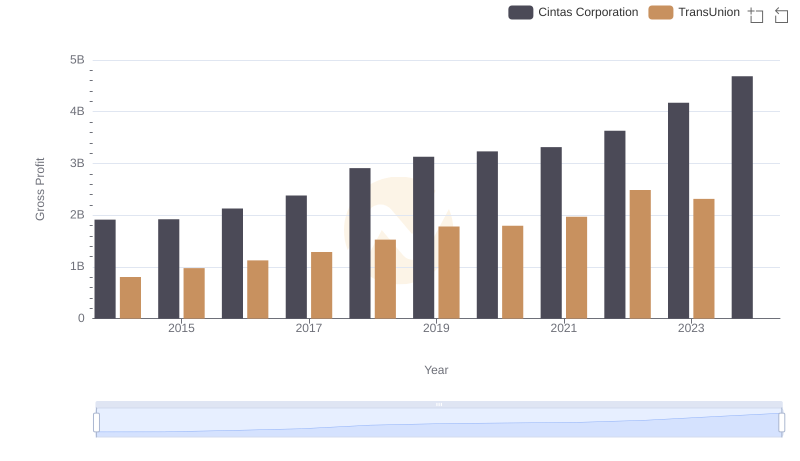
Gross Profit Trends Compared: Cintas Corporation vs TransUnion
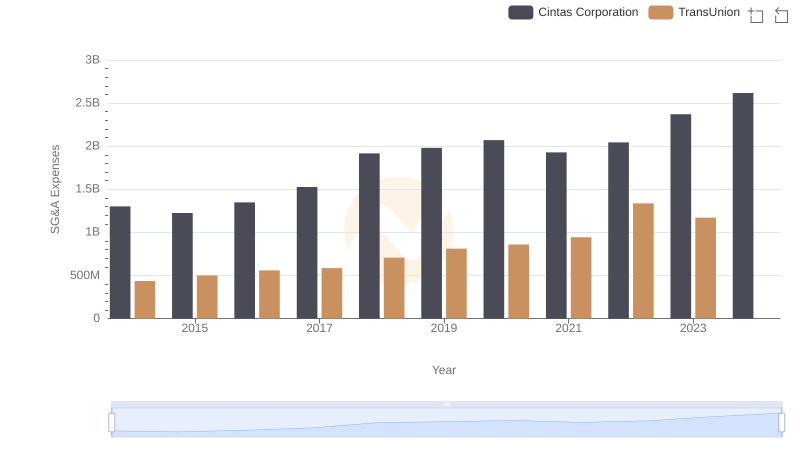
Who Optimizes SG&A Costs Better? Cintas Corporation or TransUnion
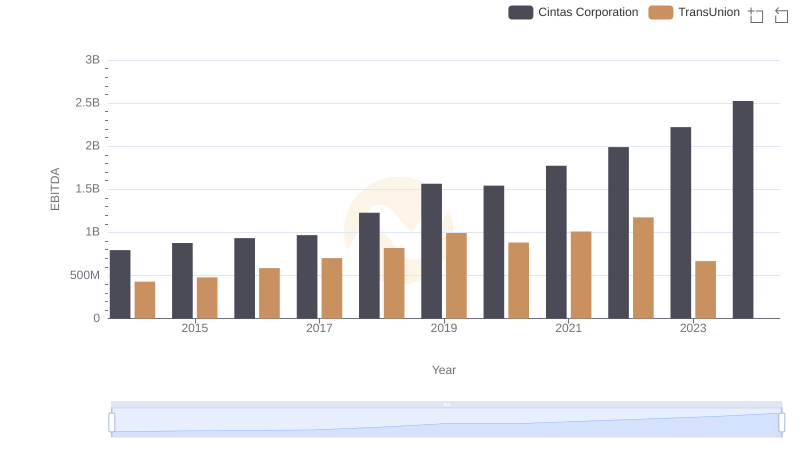
EBITDA Performance Review: Cintas Corporation vs TransUnion