| __timestamp | Cintas Corporation | Watsco, Inc. |
|---|---|---|
| Wednesday, January 1, 2014 | 1302752000 | 650655000 |
| Thursday, January 1, 2015 | 1224930000 | 670609000 |
| Friday, January 1, 2016 | 1348122000 | 688952000 |
| Sunday, January 1, 2017 | 1527380000 | 715671000 |
| Monday, January 1, 2018 | 1916792000 | 757452000 |
| Tuesday, January 1, 2019 | 1980644000 | 800328000 |
| Wednesday, January 1, 2020 | 2071052000 | 833051000 |
| Friday, January 1, 2021 | 1929159000 | 1058316000 |
| Saturday, January 1, 2022 | 2044876000 | 1221382000 |
| Sunday, January 1, 2023 | 2370704000 | 1185626000 |
| Monday, January 1, 2024 | 2617783000 | 1262938000 |
Cracking the code
In the competitive landscape of corporate America, understanding the financial health of companies is crucial. This analysis focuses on the Selling, General, and Administrative (SG&A) expenses of two industry giants: Cintas Corporation and Watsco, Inc., from 2014 to 2023.
Cintas Corporation has shown a remarkable upward trend in SG&A expenses, increasing by approximately 101% over the decade. Starting at around $1.3 billion in 2014, it reached an impressive $2.4 billion by 2023. This growth reflects Cintas's strategic investments in expanding its market presence and operational capabilities.
Conversely, Watsco, Inc. experienced a more modest increase of about 82% in SG&A expenses, from $650 million in 2014 to $1.2 billion in 2022. Notably, data for 2024 is missing, indicating potential changes in reporting or strategic shifts.
These trends highlight the dynamic nature of corporate financial strategies and their impact on long-term growth.
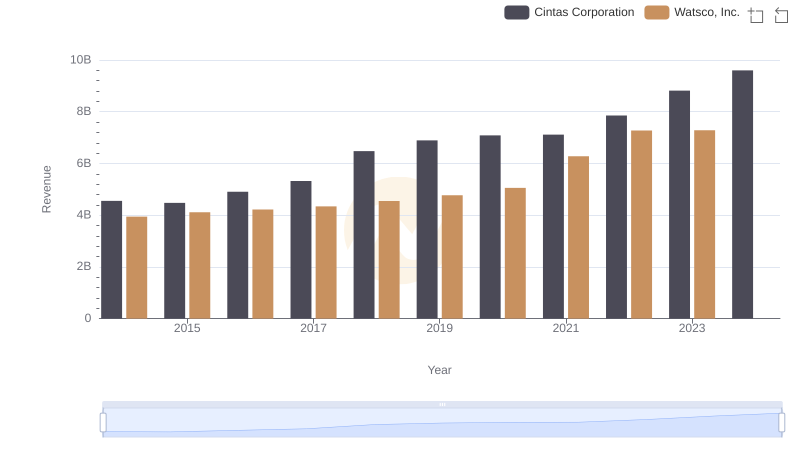
Cintas Corporation vs Watsco, Inc.: Examining Key Revenue Metrics
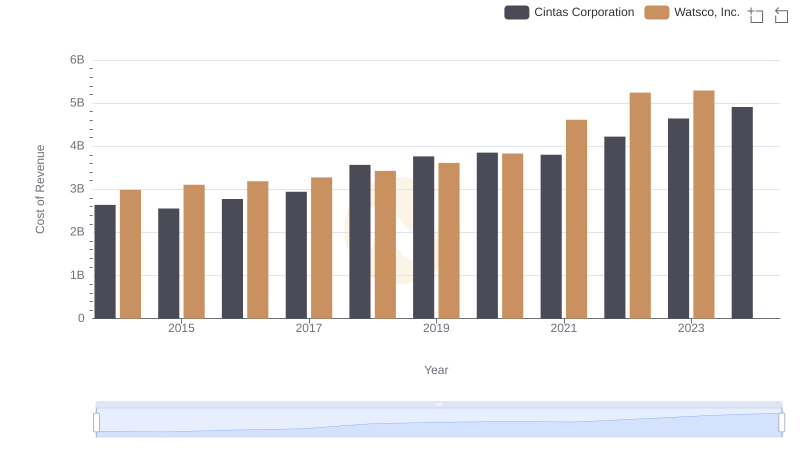
Cost of Revenue: Key Insights for Cintas Corporation and Watsco, Inc.
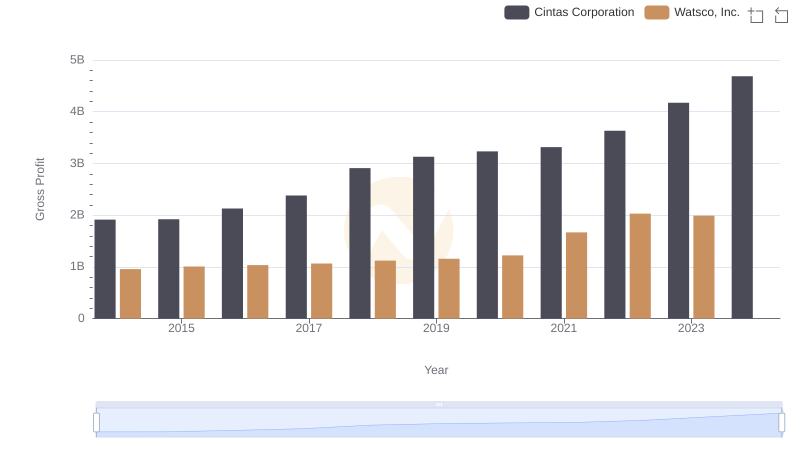
Cintas Corporation and Watsco, Inc.: A Detailed Gross Profit Analysis
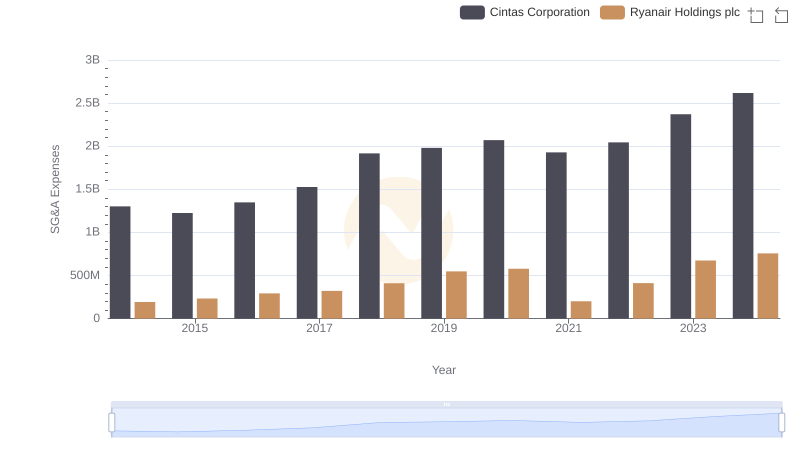
Comparing SG&A Expenses: Cintas Corporation vs Ryanair Holdings plc Trends and Insights
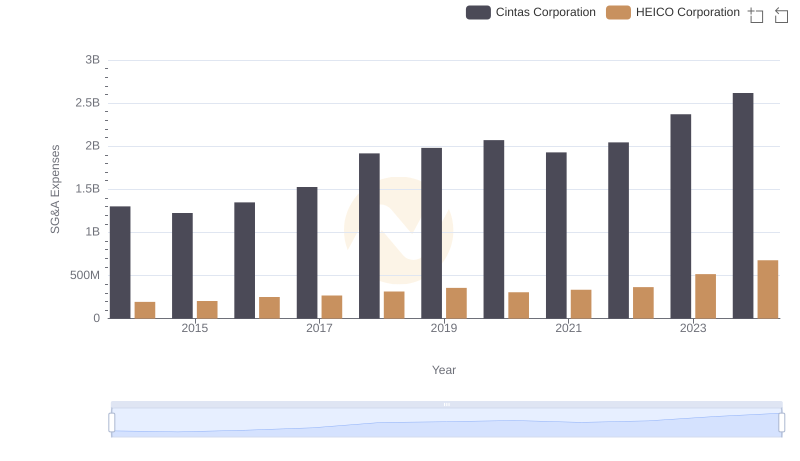
Cintas Corporation vs HEICO Corporation: SG&A Expense Trends
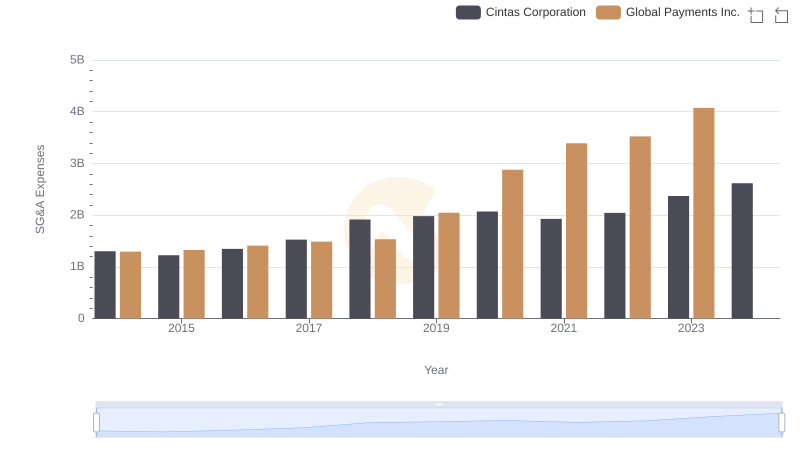
Cintas Corporation and Global Payments Inc.: SG&A Spending Patterns Compared
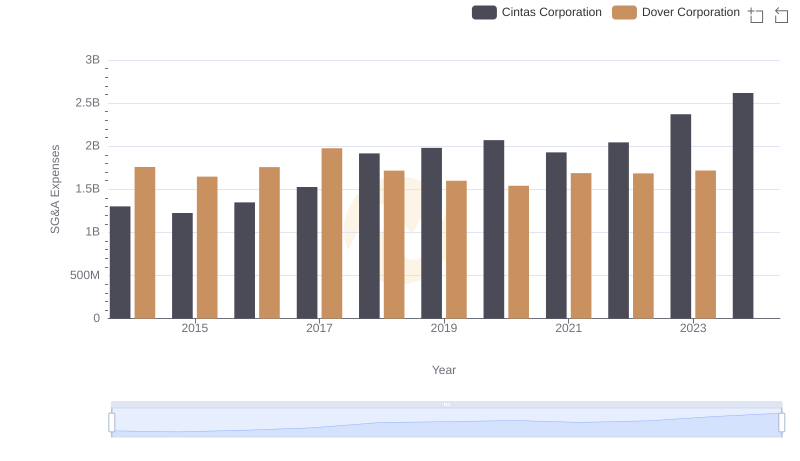
Cintas Corporation and Dover Corporation: SG&A Spending Patterns Compared
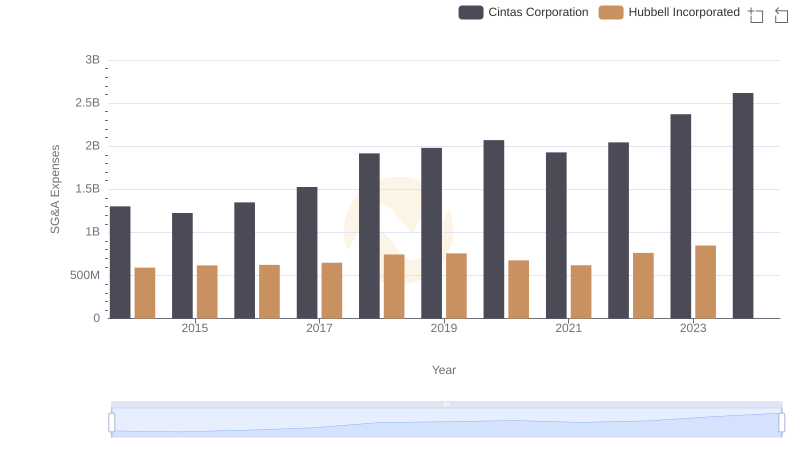
SG&A Efficiency Analysis: Comparing Cintas Corporation and Hubbell Incorporated
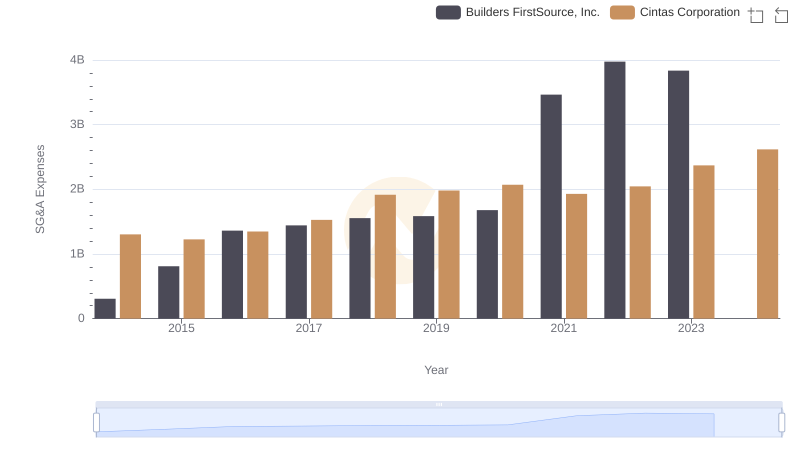
Breaking Down SG&A Expenses: Cintas Corporation vs Builders FirstSource, Inc.
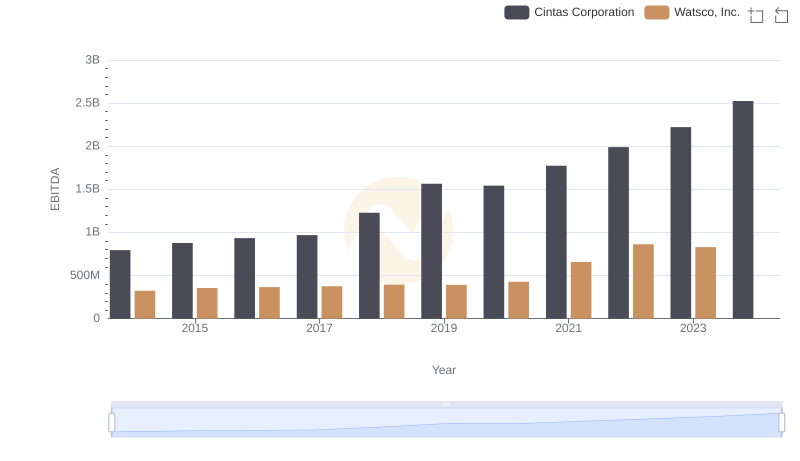
Cintas Corporation and Watsco, Inc.: A Detailed Examination of EBITDA Performance
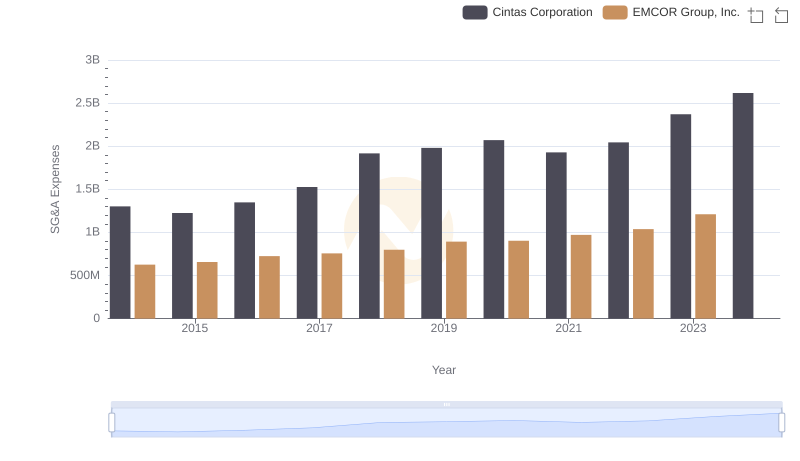
Comparing SG&A Expenses: Cintas Corporation vs EMCOR Group, Inc. Trends and Insights