| __timestamp | Cintas Corporation | TransUnion |
|---|---|---|
| Wednesday, January 1, 2014 | 793811000 | 429400000 |
| Thursday, January 1, 2015 | 877761000 | 478200000 |
| Friday, January 1, 2016 | 933728000 | 585300000 |
| Sunday, January 1, 2017 | 968293000 | 701100000 |
| Monday, January 1, 2018 | 1227852000 | 819800000 |
| Tuesday, January 1, 2019 | 1564228000 | 993200000 |
| Wednesday, January 1, 2020 | 1542737000 | 883400000 |
| Friday, January 1, 2021 | 1773591000 | 1010500000 |
| Saturday, January 1, 2022 | 1990046000 | 1173800000 |
| Sunday, January 1, 2023 | 2221676000 | 667300000 |
| Monday, January 1, 2024 | 2523857000 | 1204100000 |
Igniting the spark of knowledge
In the competitive landscape of corporate finance, EBITDA serves as a crucial indicator of a company's operational performance. Over the past decade, Cintas Corporation has demonstrated a remarkable upward trajectory in its EBITDA, growing by approximately 218% from 2014 to 2023. This growth reflects Cintas's strategic initiatives and robust market positioning. In contrast, TransUnion's EBITDA has shown a more modest increase of around 173% over the same period, with a notable dip in 2023. This decline could be attributed to market fluctuations or strategic shifts within the company. Notably, Cintas's EBITDA surpassed TransUnion's by a significant margin in recent years, highlighting its superior operational efficiency. As we look to 2024, Cintas continues its upward trend, while TransUnion's data remains incomplete, leaving room for speculation on its future performance.
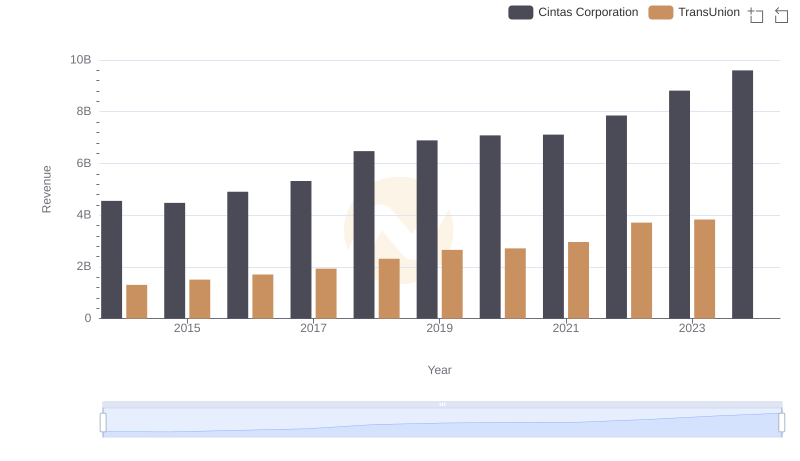
Cintas Corporation or TransUnion: Who Leads in Yearly Revenue?
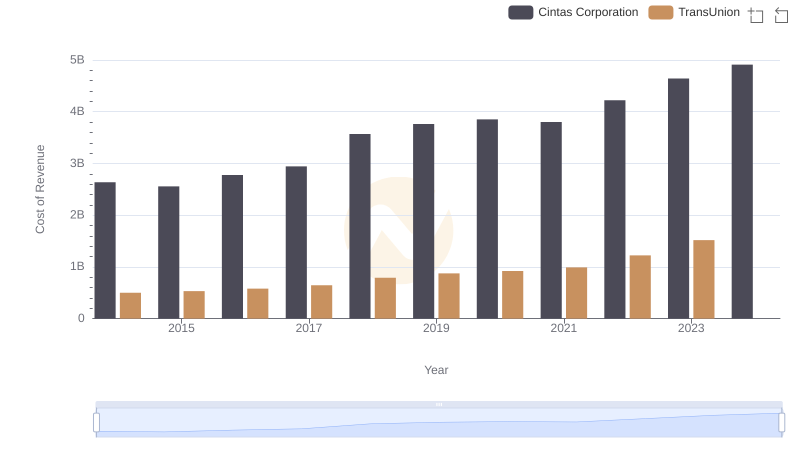
Cost of Revenue Trends: Cintas Corporation vs TransUnion
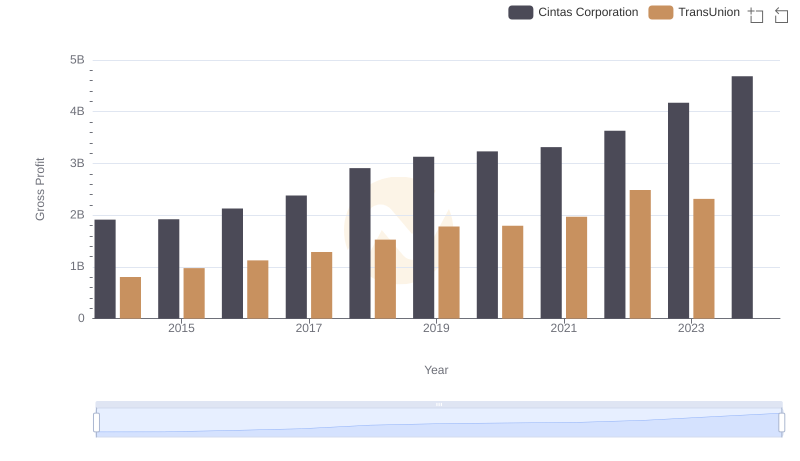
Gross Profit Trends Compared: Cintas Corporation vs TransUnion
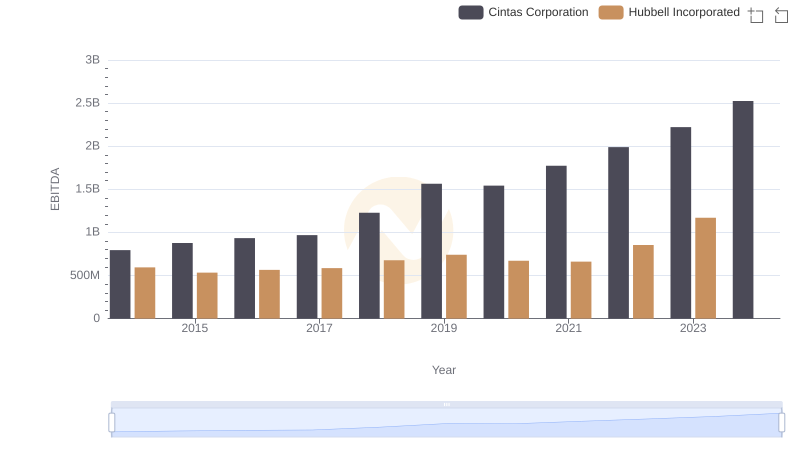
EBITDA Metrics Evaluated: Cintas Corporation vs Hubbell Incorporated
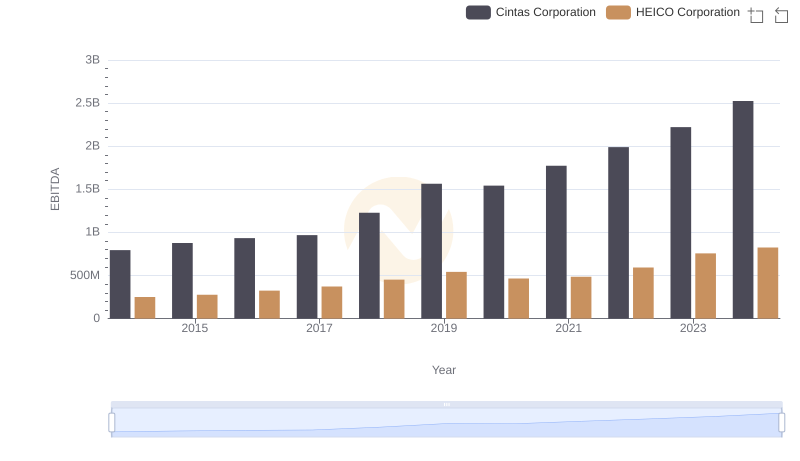
A Professional Review of EBITDA: Cintas Corporation Compared to HEICO Corporation
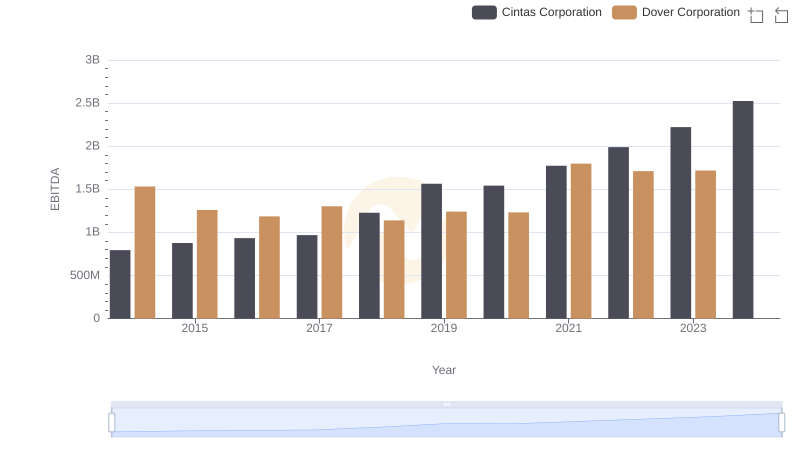
EBITDA Performance Review: Cintas Corporation vs Dover Corporation
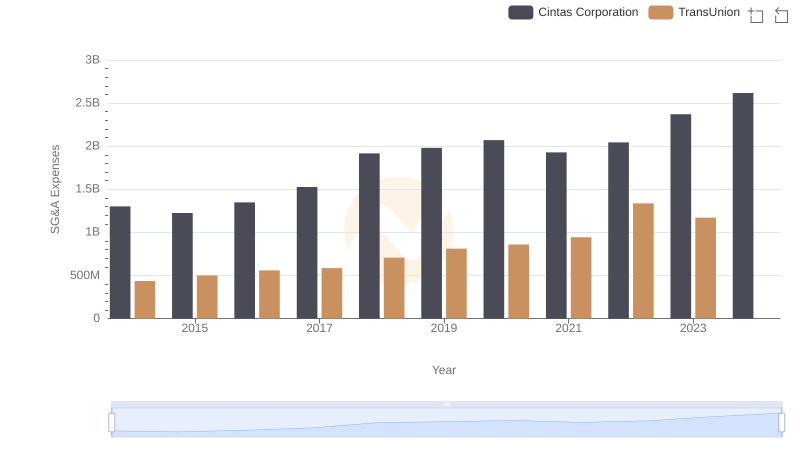
Who Optimizes SG&A Costs Better? Cintas Corporation or TransUnion
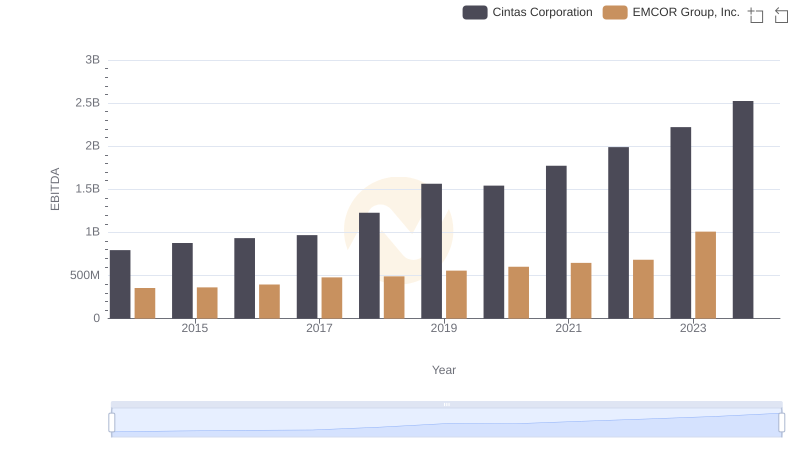
EBITDA Analysis: Evaluating Cintas Corporation Against EMCOR Group, Inc.
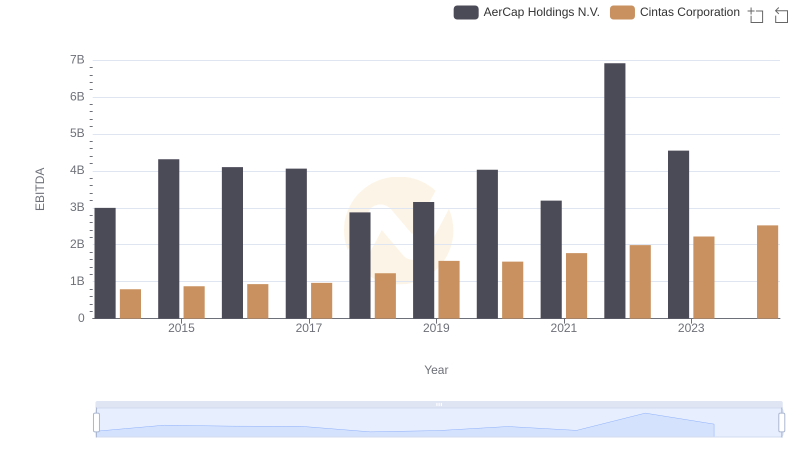
EBITDA Performance Review: Cintas Corporation vs AerCap Holdings N.V.
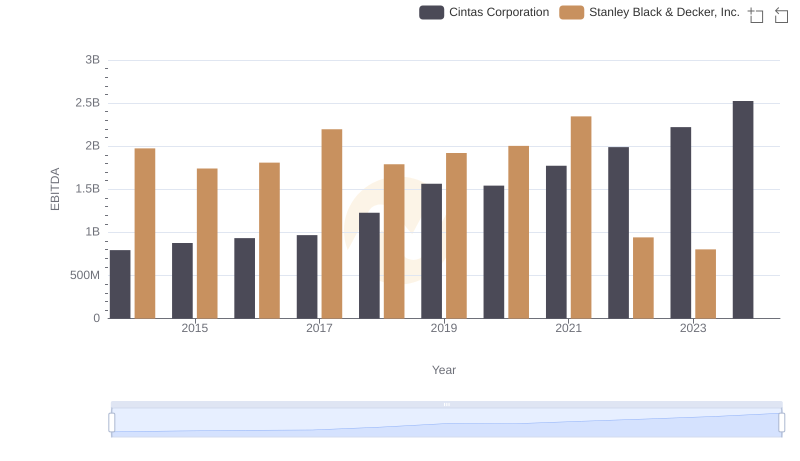
Cintas Corporation vs Stanley Black & Decker, Inc.: In-Depth EBITDA Performance Comparison
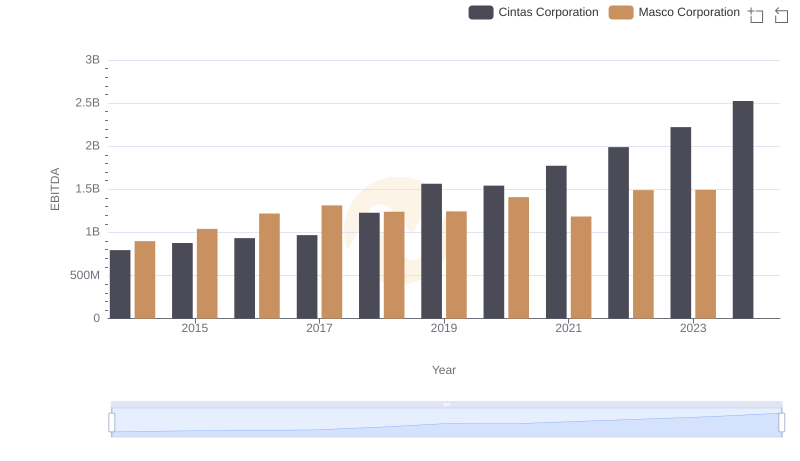
Cintas Corporation and Masco Corporation: A Detailed Examination of EBITDA Performance