| __timestamp | Cintas Corporation | TransUnion |
|---|---|---|
| Wednesday, January 1, 2014 | 1914386000 | 805600000 |
| Thursday, January 1, 2015 | 1921337000 | 975200000 |
| Friday, January 1, 2016 | 2129870000 | 1125800000 |
| Sunday, January 1, 2017 | 2380295000 | 1288100000 |
| Monday, January 1, 2018 | 2908523000 | 1527100000 |
| Tuesday, January 1, 2019 | 3128588000 | 1782000000 |
| Wednesday, January 1, 2020 | 3233748000 | 1796200000 |
| Friday, January 1, 2021 | 3314651000 | 1968600000 |
| Saturday, January 1, 2022 | 3632246000 | 2487000000 |
| Sunday, January 1, 2023 | 4173368000 | 2313900000 |
| Monday, January 1, 2024 | 4686416000 | 4183800000 |
Infusing magic into the data realm
In the competitive landscape of American business, Cintas Corporation and TransUnion have showcased intriguing trends in their gross profit margins over the past decade. Since 2014, Cintas has consistently outperformed TransUnion, with its gross profit growing by approximately 145% by 2023. This remarkable growth trajectory highlights Cintas's strategic prowess in the uniform and facility services industry.
TransUnion, a leader in credit reporting, has also demonstrated steady growth, with its gross profit increasing by about 187% from 2014 to 2022. However, data for 2024 is currently unavailable, leaving room for speculation on its future performance.
These trends underscore the resilience and adaptability of both companies in their respective sectors. As we look to the future, the question remains: will Cintas continue its upward trajectory, and can TransUnion close the gap in the coming years?
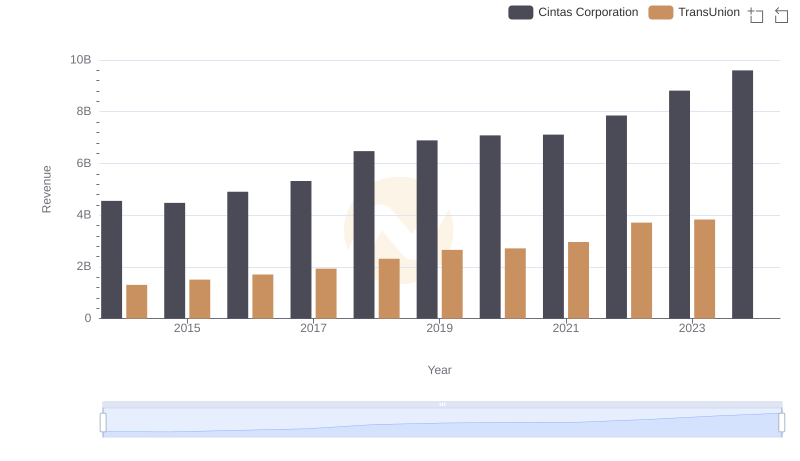
Cintas Corporation or TransUnion: Who Leads in Yearly Revenue?
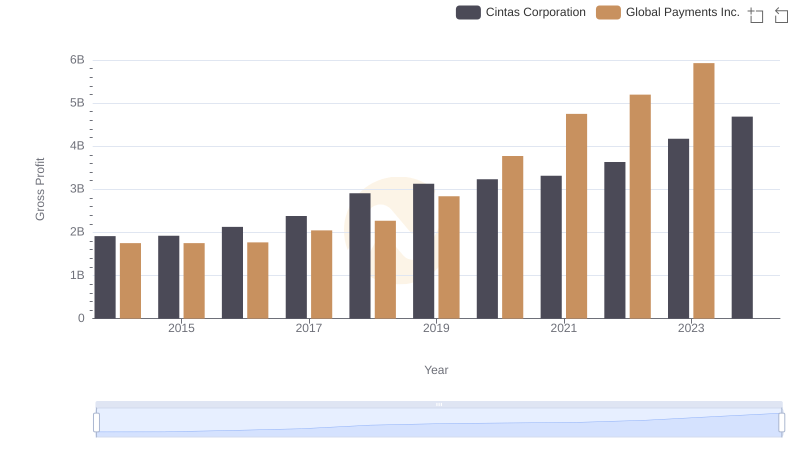
Who Generates Higher Gross Profit? Cintas Corporation or Global Payments Inc.
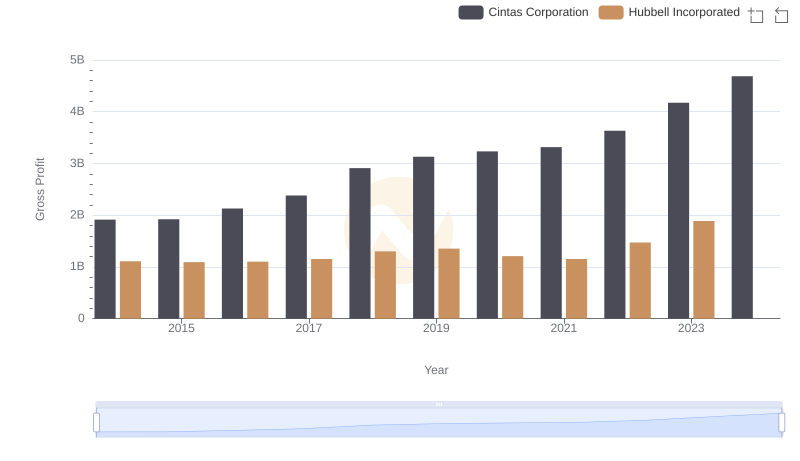
Gross Profit Comparison: Cintas Corporation and Hubbell Incorporated Trends
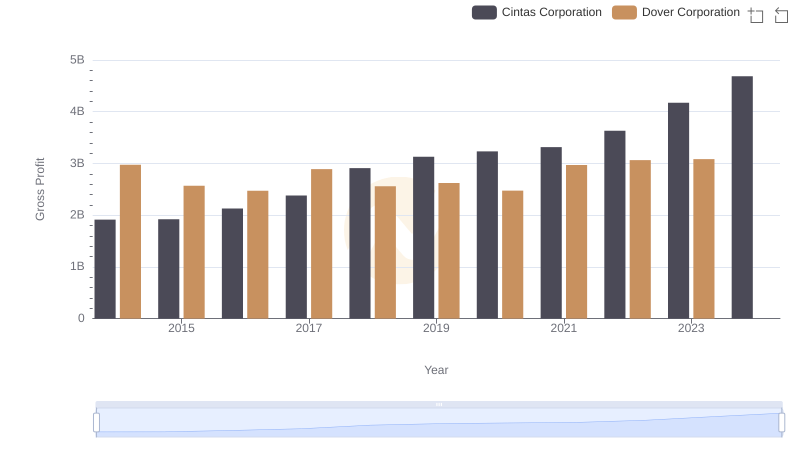
Gross Profit Analysis: Comparing Cintas Corporation and Dover Corporation
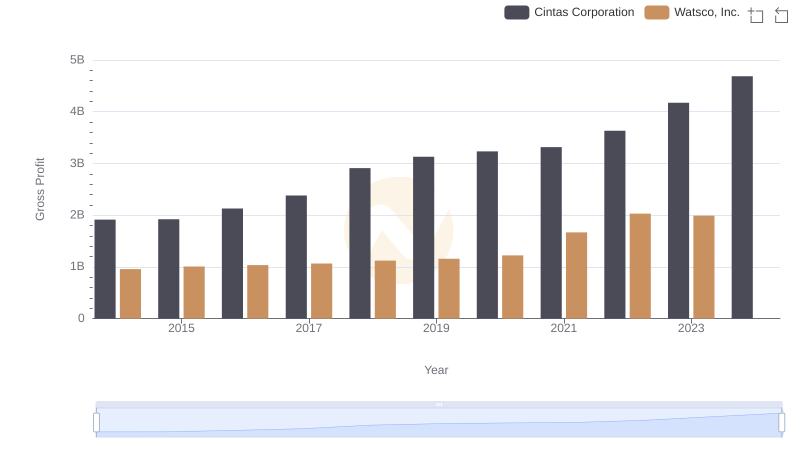
Cintas Corporation and Watsco, Inc.: A Detailed Gross Profit Analysis
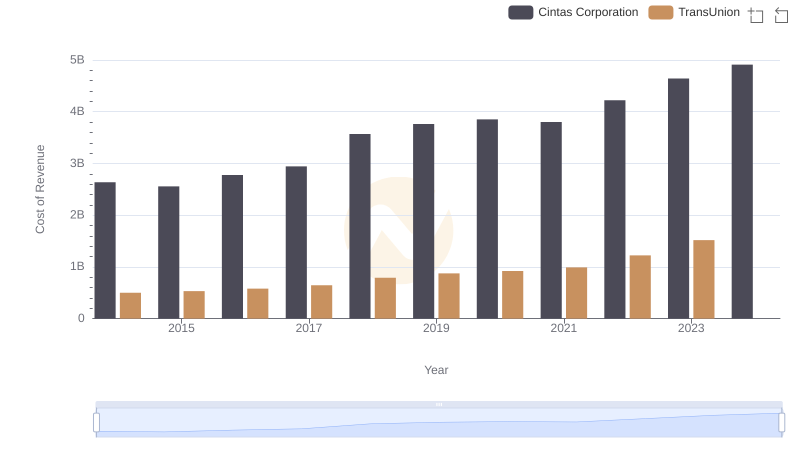
Cost of Revenue Trends: Cintas Corporation vs TransUnion
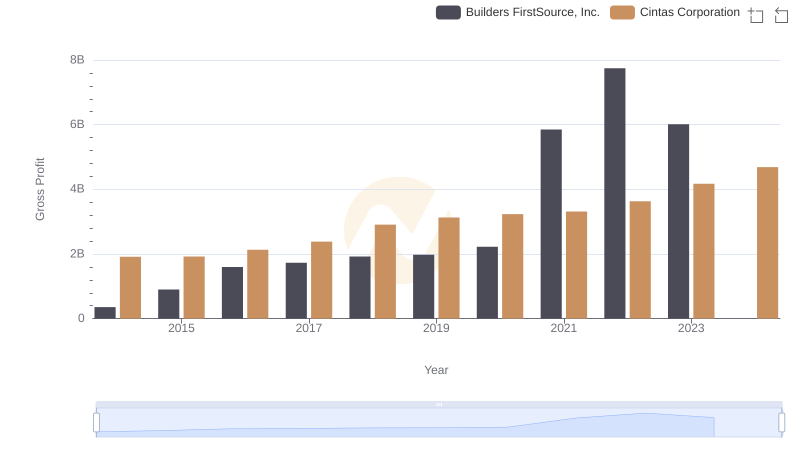
Key Insights on Gross Profit: Cintas Corporation vs Builders FirstSource, Inc.
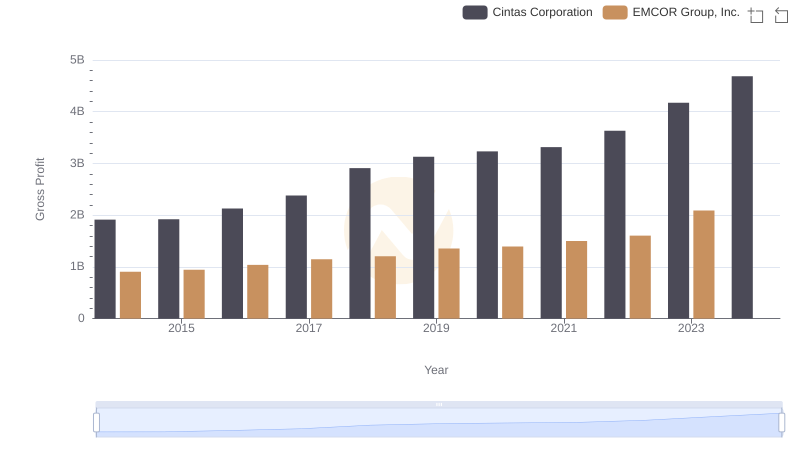
Gross Profit Trends Compared: Cintas Corporation vs EMCOR Group, Inc.

Who Generates Higher Gross Profit? Cintas Corporation or AerCap Holdings N.V.
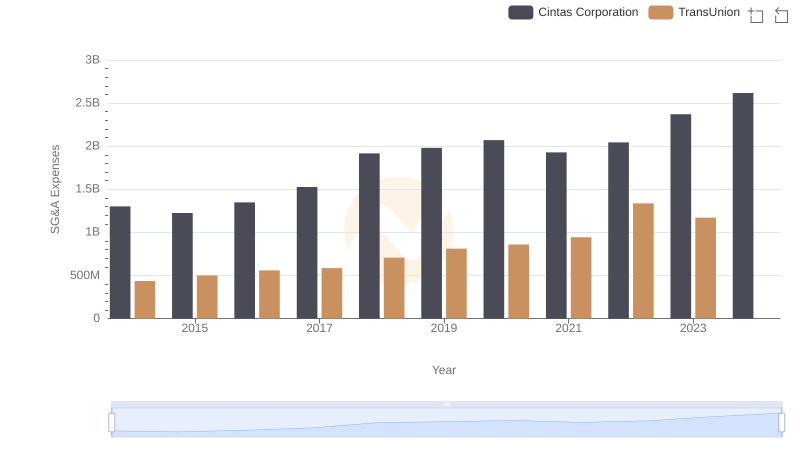
Who Optimizes SG&A Costs Better? Cintas Corporation or TransUnion
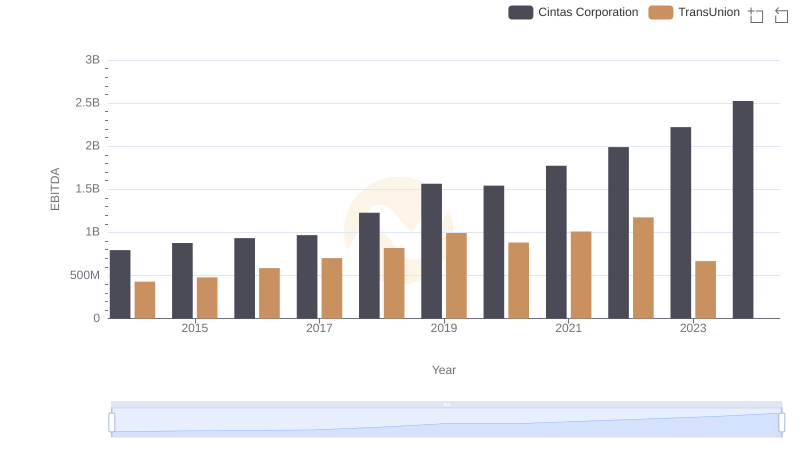
EBITDA Performance Review: Cintas Corporation vs TransUnion