| __timestamp | Masco Corporation | United Rentals, Inc. |
|---|---|---|
| Wednesday, January 1, 2014 | 1607000000 | 758000000 |
| Thursday, January 1, 2015 | 1339000000 | 714000000 |
| Friday, January 1, 2016 | 1403000000 | 719000000 |
| Sunday, January 1, 2017 | 1442000000 | 903000000 |
| Monday, January 1, 2018 | 1478000000 | 1038000000 |
| Tuesday, January 1, 2019 | 1274000000 | 1092000000 |
| Wednesday, January 1, 2020 | 1292000000 | 979000000 |
| Friday, January 1, 2021 | 1413000000 | 1199000000 |
| Saturday, January 1, 2022 | 1390000000 | 1400000000 |
| Sunday, January 1, 2023 | 1481000000 | 1527000000 |
| Monday, January 1, 2024 | 1468000000 | 1645000000 |
Infusing magic into the data realm
In the competitive landscape of corporate America, understanding the efficiency of Selling, General, and Administrative (SG&A) expenses is crucial. Over the past decade, Masco Corporation and United Rentals, Inc. have showcased contrasting trends in their SG&A expenditures.
From 2014 to 2023, Masco Corporation's SG&A expenses fluctuated, peaking in 2014 and 2023, with a notable dip in 2019. This reflects a strategic shift, possibly aligning with market demands and internal restructuring. In contrast, United Rentals, Inc. demonstrated a consistent upward trajectory, with a remarkable 113% increase from 2014 to 2023. This growth could indicate aggressive expansion and investment in operational efficiencies.
Interestingly, 2022 marked a pivotal year where United Rentals surpassed Masco in SG&A expenses, highlighting a shift in operational dynamics. However, data for 2024 remains incomplete, leaving room for speculation on future trends.
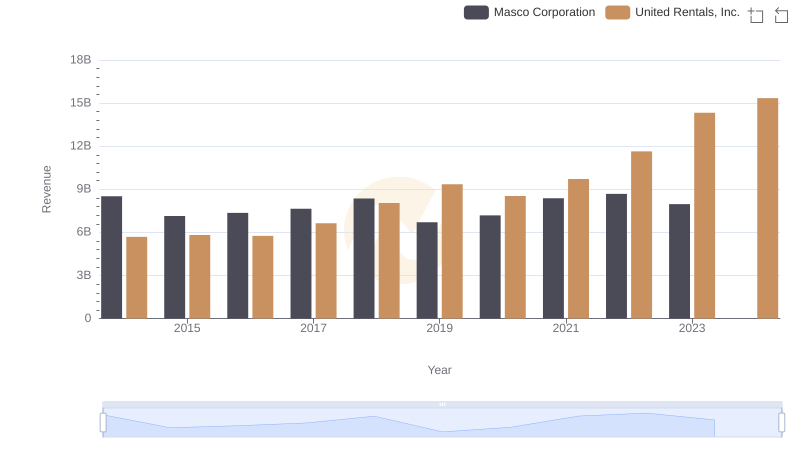
United Rentals, Inc. or Masco Corporation: Who Leads in Yearly Revenue?
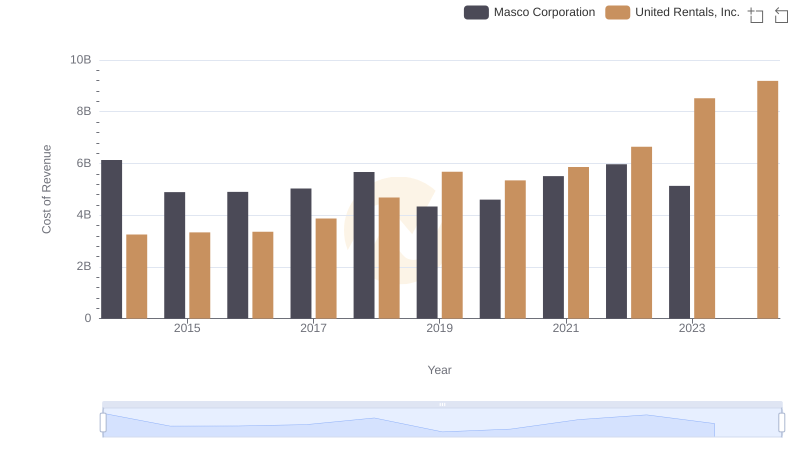
Comparing Cost of Revenue Efficiency: United Rentals, Inc. vs Masco Corporation
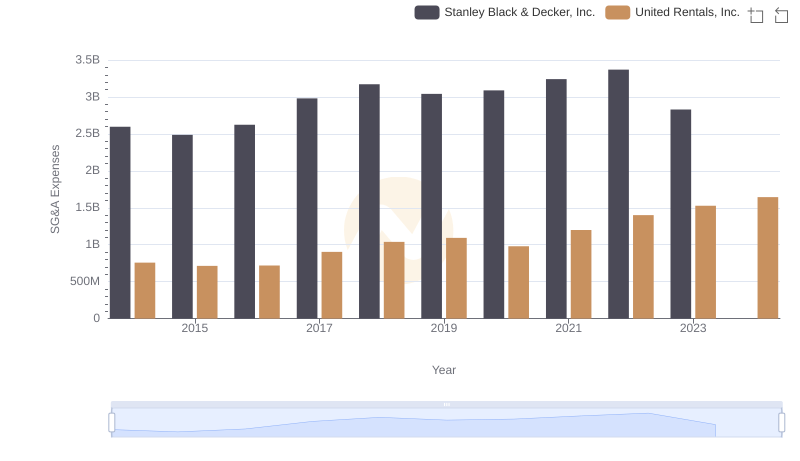
Selling, General, and Administrative Costs: United Rentals, Inc. vs Stanley Black & Decker, Inc.
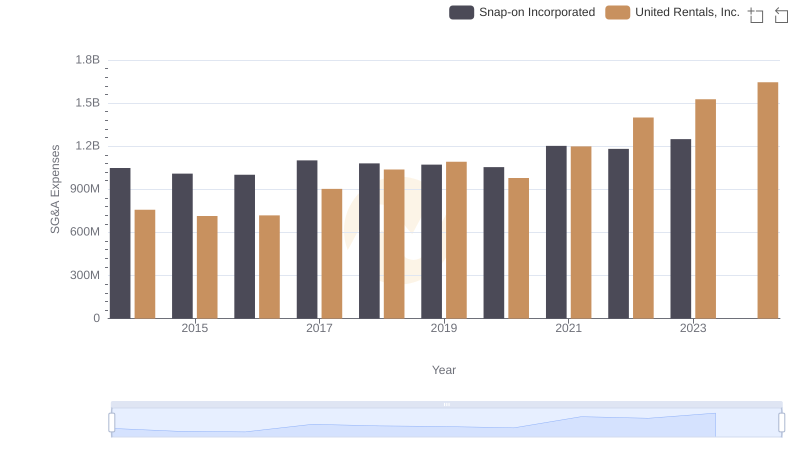
United Rentals, Inc. and Snap-on Incorporated: SG&A Spending Patterns Compared
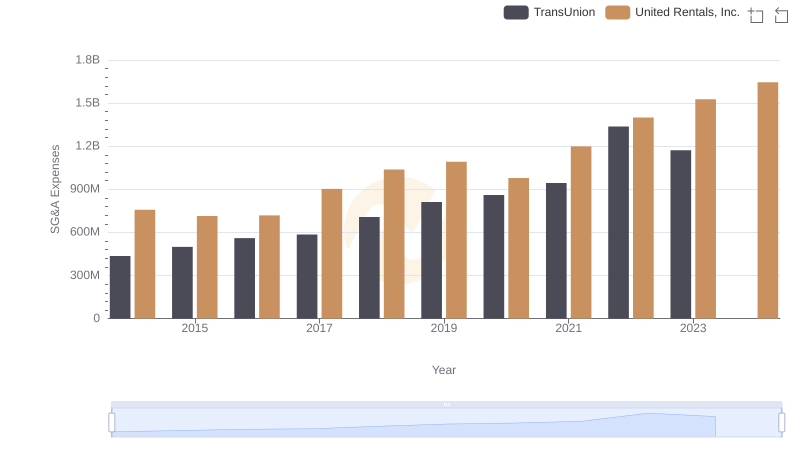
Breaking Down SG&A Expenses: United Rentals, Inc. vs TransUnion
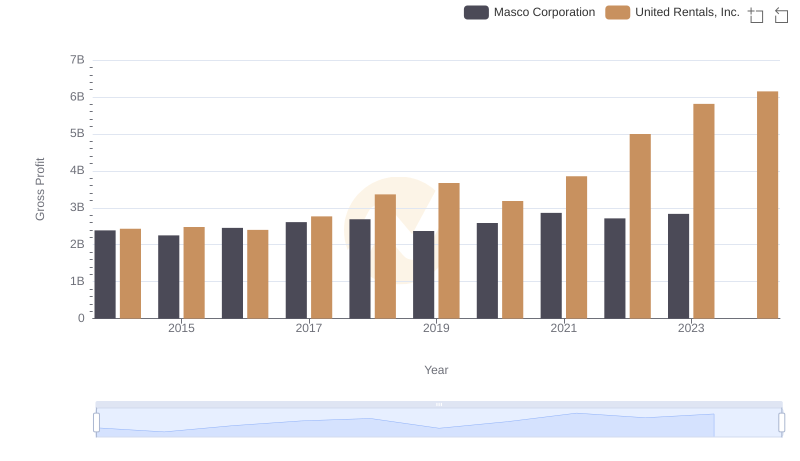
United Rentals, Inc. vs Masco Corporation: A Gross Profit Performance Breakdown
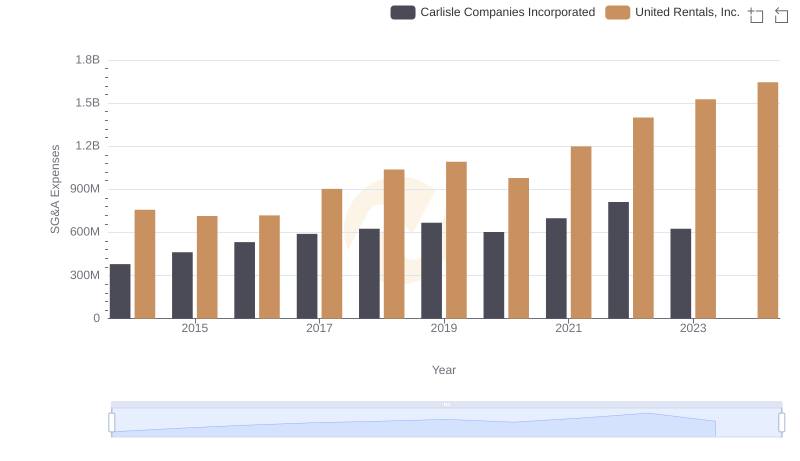
Who Optimizes SG&A Costs Better? United Rentals, Inc. or Carlisle Companies Incorporated
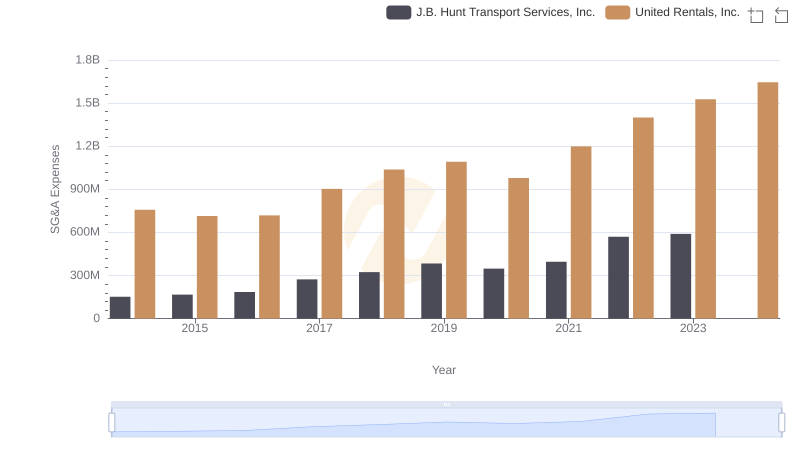
Breaking Down SG&A Expenses: United Rentals, Inc. vs J.B. Hunt Transport Services, Inc.
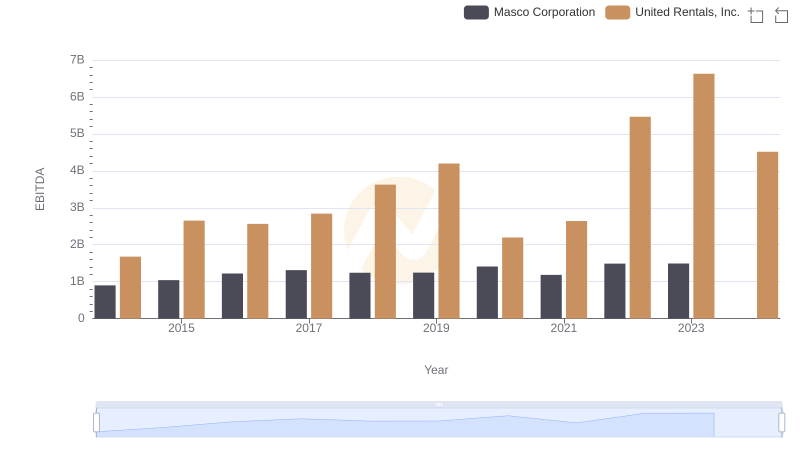
United Rentals, Inc. and Masco Corporation: A Detailed Examination of EBITDA Performance
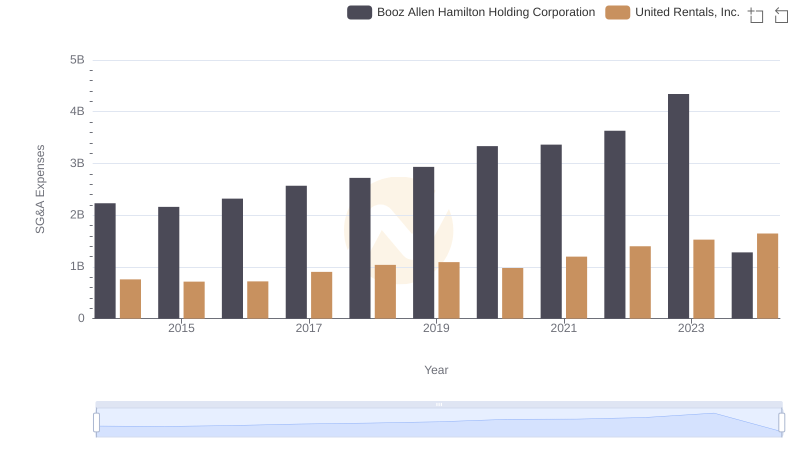
United Rentals, Inc. and Booz Allen Hamilton Holding Corporation: SG&A Spending Patterns Compared
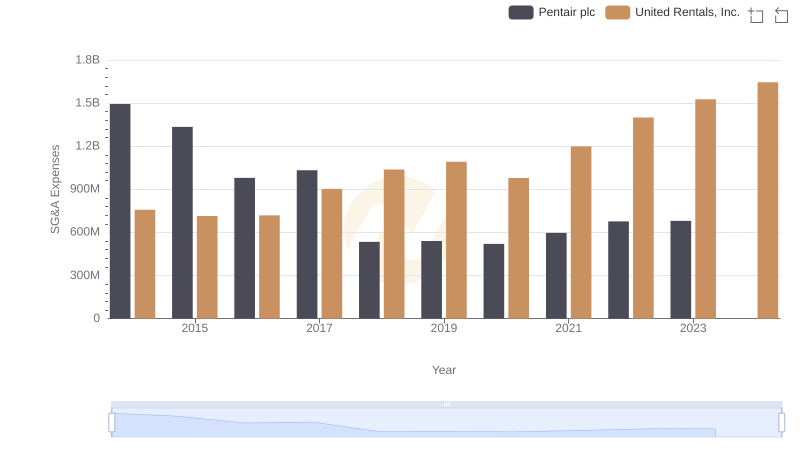
United Rentals, Inc. vs Pentair plc: SG&A Expense Trends
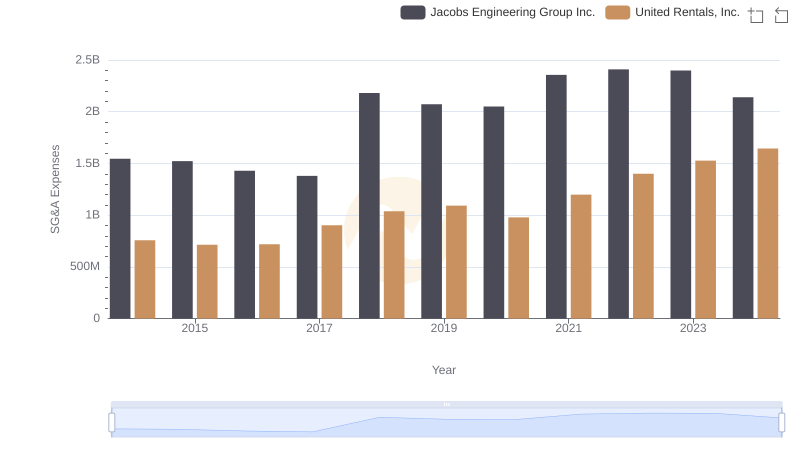
Who Optimizes SG&A Costs Better? United Rentals, Inc. or Jacobs Engineering Group Inc.