| __timestamp | Masco Corporation | United Rentals, Inc. |
|---|---|---|
| Wednesday, January 1, 2014 | 899000000 | 1678000000 |
| Thursday, January 1, 2015 | 1041000000 | 2653000000 |
| Friday, January 1, 2016 | 1220000000 | 2566000000 |
| Sunday, January 1, 2017 | 1314000000 | 2843000000 |
| Monday, January 1, 2018 | 1240000000 | 3628000000 |
| Tuesday, January 1, 2019 | 1244000000 | 4200000000 |
| Wednesday, January 1, 2020 | 1410000000 | 2195000000 |
| Friday, January 1, 2021 | 1185000000 | 2642000000 |
| Saturday, January 1, 2022 | 1490000000 | 5464000000 |
| Sunday, January 1, 2023 | 1493000000 | 6627000000 |
| Monday, January 1, 2024 | 1410000000 | 4516000000 |
Unveiling the hidden dimensions of data
In the ever-evolving landscape of industrial and home improvement sectors, United Rentals, Inc. and Masco Corporation stand as titans. Over the past decade, United Rentals has demonstrated a remarkable growth trajectory, with its EBITDA surging by nearly 295% from 2014 to 2023. This growth underscores its strategic expansions and robust market positioning. In contrast, Masco Corporation, a leader in home improvement products, has shown a steady yet modest increase of approximately 66% in EBITDA over the same period. The year 2023 marked a pinnacle for United Rentals, achieving an EBITDA of 6.63 billion, while Masco reached 1.49 billion. However, 2024 data for Masco remains elusive, hinting at potential market shifts or reporting delays. This comparative analysis not only highlights the dynamic nature of these industries but also offers insights into the strategic maneuvers of these corporate giants.
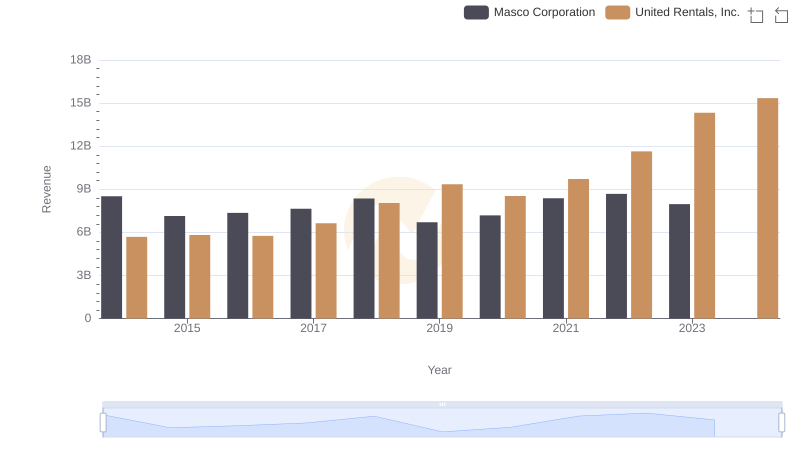
United Rentals, Inc. or Masco Corporation: Who Leads in Yearly Revenue?
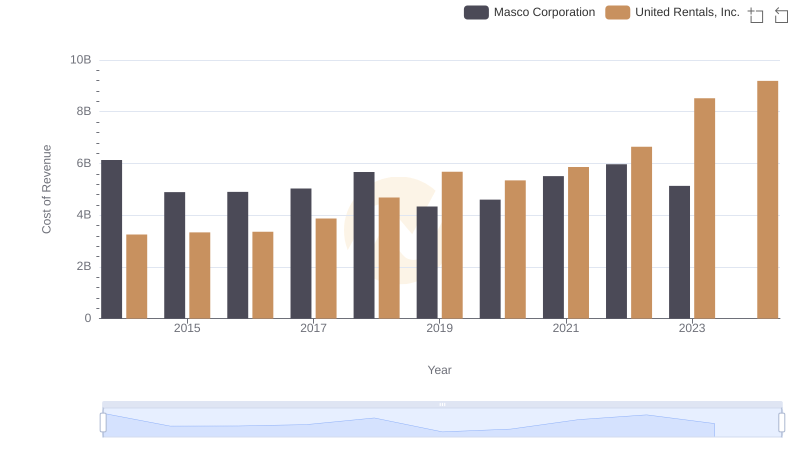
Comparing Cost of Revenue Efficiency: United Rentals, Inc. vs Masco Corporation
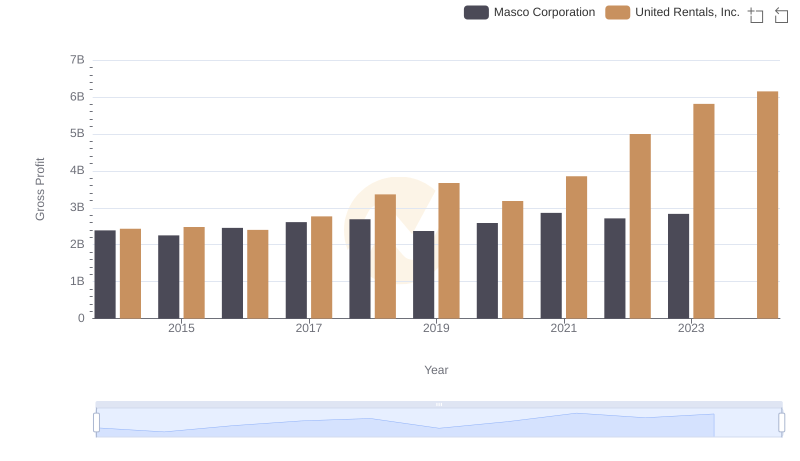
United Rentals, Inc. vs Masco Corporation: A Gross Profit Performance Breakdown
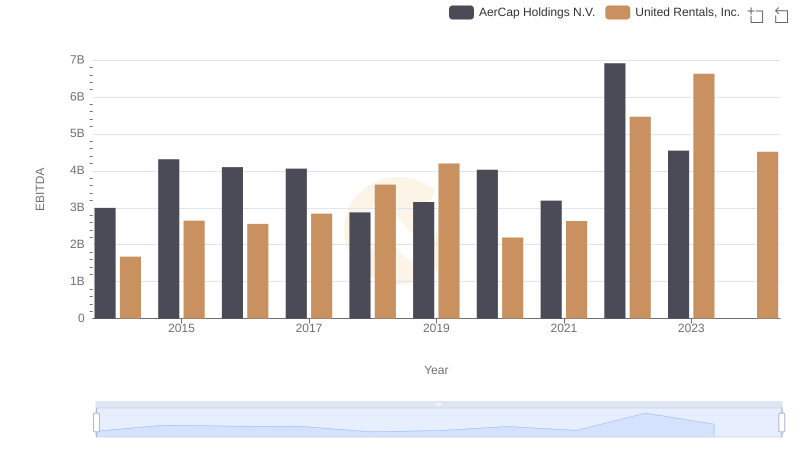
Comparative EBITDA Analysis: United Rentals, Inc. vs AerCap Holdings N.V.
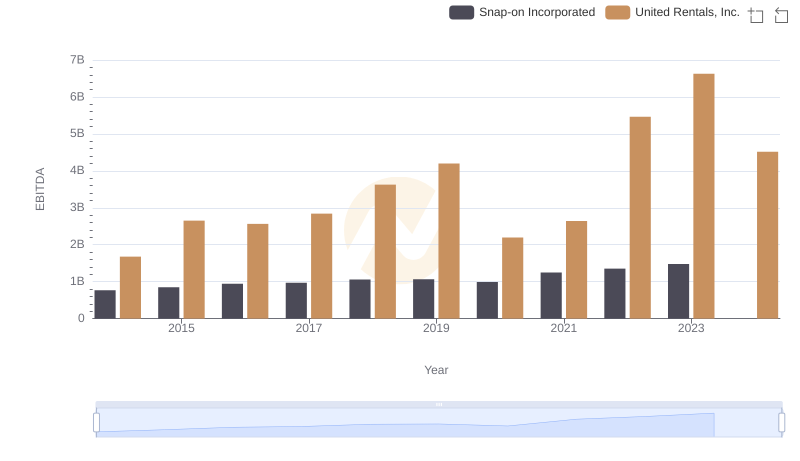
Comparative EBITDA Analysis: United Rentals, Inc. vs Snap-on Incorporated
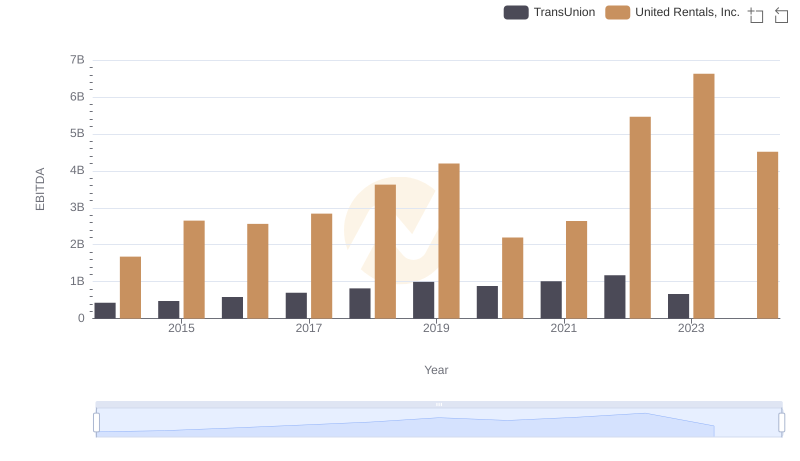
EBITDA Performance Review: United Rentals, Inc. vs TransUnion
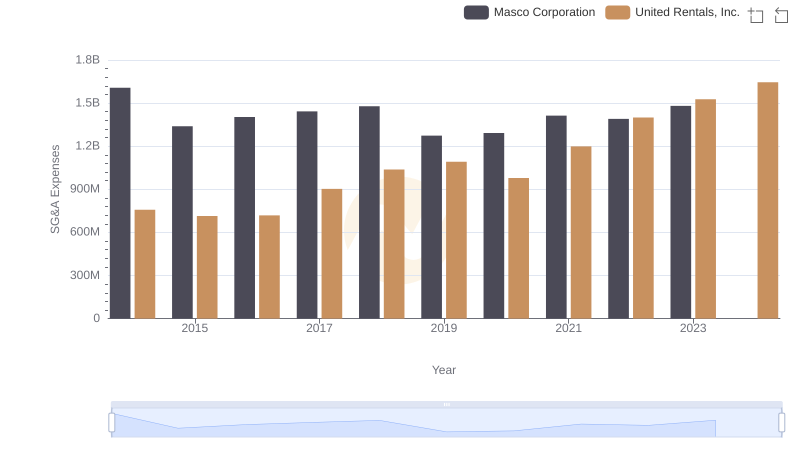
SG&A Efficiency Analysis: Comparing United Rentals, Inc. and Masco Corporation
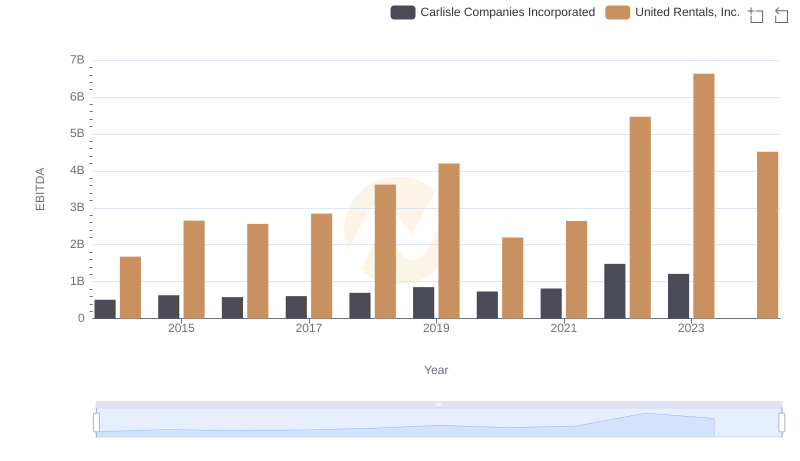
EBITDA Analysis: Evaluating United Rentals, Inc. Against Carlisle Companies Incorporated
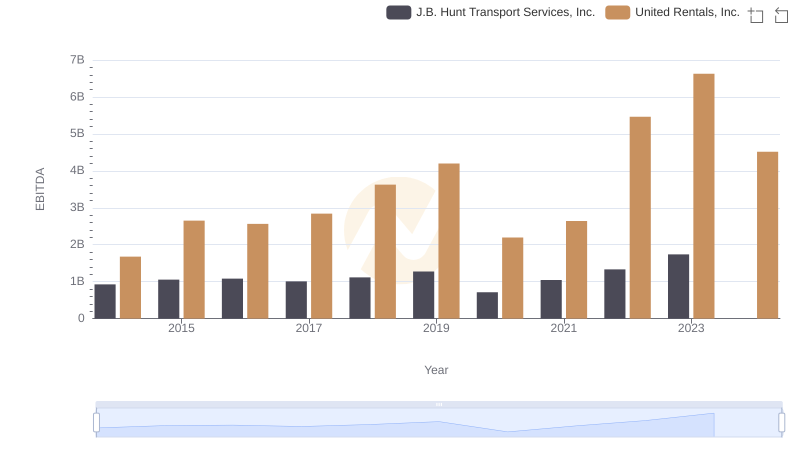
EBITDA Analysis: Evaluating United Rentals, Inc. Against J.B. Hunt Transport Services, Inc.
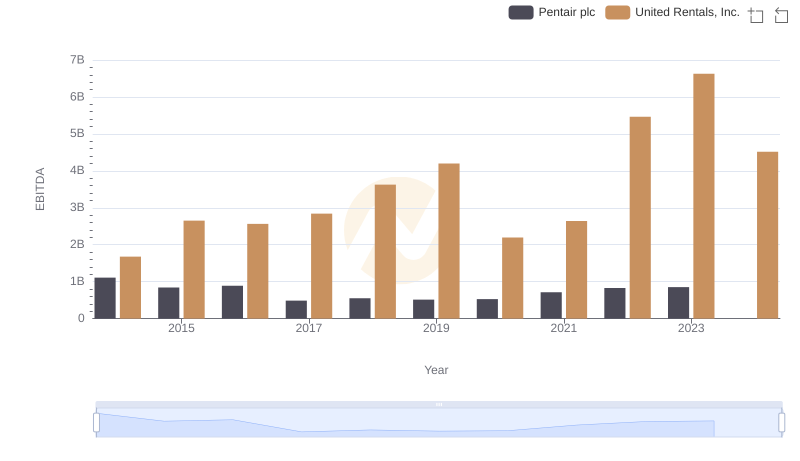
Comprehensive EBITDA Comparison: United Rentals, Inc. vs Pentair plc

Comparative EBITDA Analysis: United Rentals, Inc. vs IDEX Corporation