| __timestamp | Masco Corporation | United Rentals, Inc. |
|---|---|---|
| Wednesday, January 1, 2014 | 8521000000 | 5685000000 |
| Thursday, January 1, 2015 | 7142000000 | 5817000000 |
| Friday, January 1, 2016 | 7357000000 | 5762000000 |
| Sunday, January 1, 2017 | 7644000000 | 6641000000 |
| Monday, January 1, 2018 | 8359000000 | 8047000000 |
| Tuesday, January 1, 2019 | 6707000000 | 9351000000 |
| Wednesday, January 1, 2020 | 7188000000 | 8530000000 |
| Friday, January 1, 2021 | 8375000000 | 9716000000 |
| Saturday, January 1, 2022 | 8680000000 | 11642000000 |
| Sunday, January 1, 2023 | 7967000000 | 14332000000 |
| Monday, January 1, 2024 | 7828000000 | 15345000000 |
Infusing magic into the data realm
In the competitive landscape of industrial services and home improvement, United Rentals, Inc. and Masco Corporation have been vying for the top spot in annual revenue. Over the past decade, United Rentals has consistently outpaced Masco, with a notable surge in 2023, reaching approximately 14.3 billion USD, a 23% increase from the previous year. Meanwhile, Masco's revenue has shown fluctuations, peaking in 2022 at around 8.7 billion USD before dipping slightly in 2023.
United Rentals' growth trajectory is impressive, with a 170% increase since 2014, reflecting its strategic expansions and acquisitions. In contrast, Masco's revenue has grown by a modest 6% over the same period, highlighting its steady yet slower pace. As we look to the future, the data suggests United Rentals is poised to maintain its lead, barring any unforeseen market shifts.
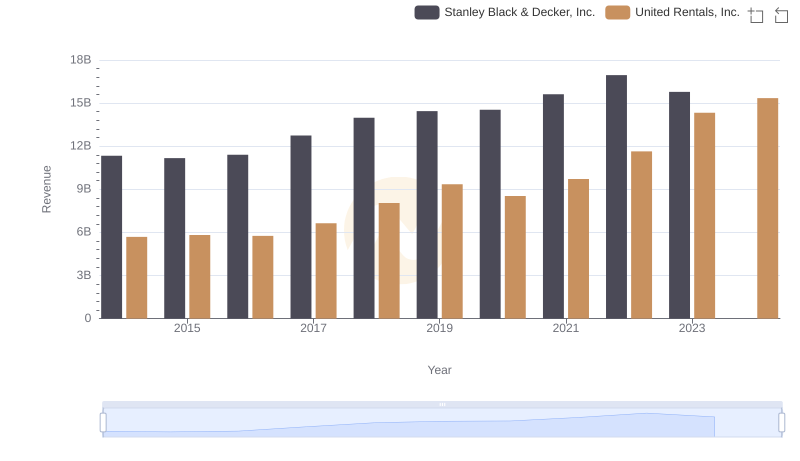
Comparing Revenue Performance: United Rentals, Inc. or Stanley Black & Decker, Inc.?
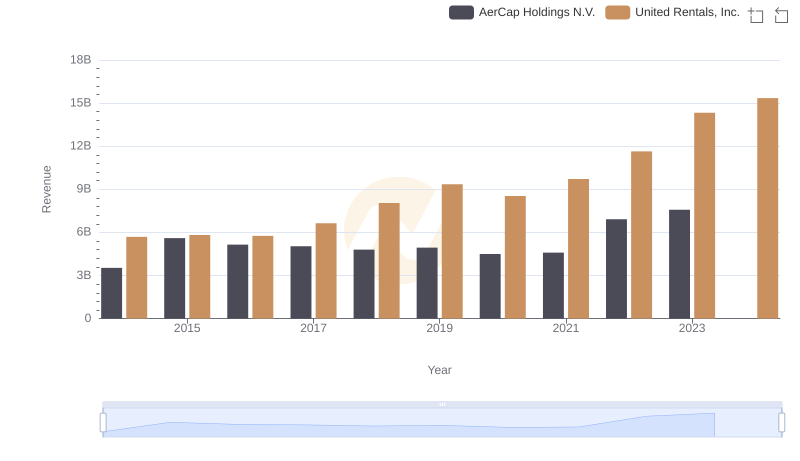
United Rentals, Inc. vs AerCap Holdings N.V.: Annual Revenue Growth Compared
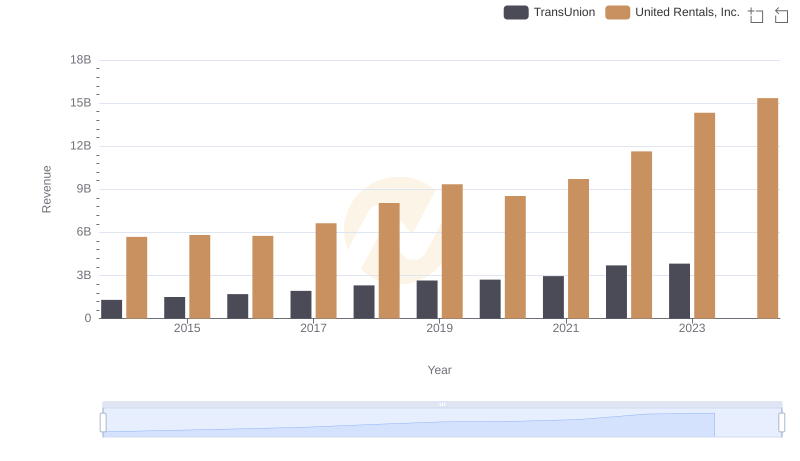
Comparing Revenue Performance: United Rentals, Inc. or TransUnion?
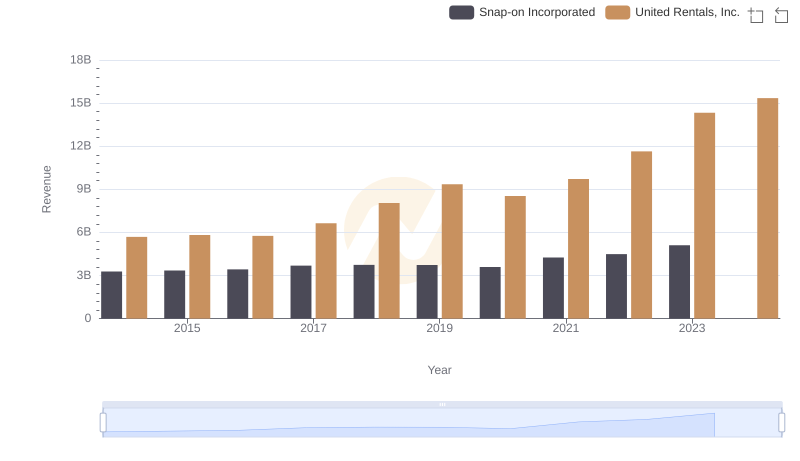
Breaking Down Revenue Trends: United Rentals, Inc. vs Snap-on Incorporated
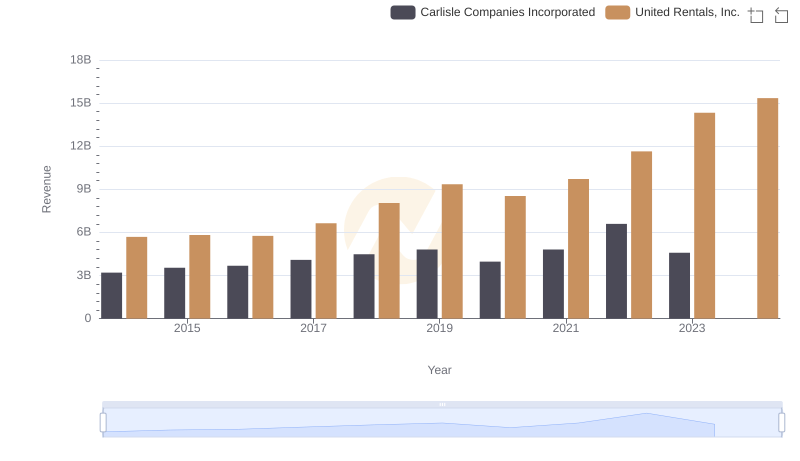
Annual Revenue Comparison: United Rentals, Inc. vs Carlisle Companies Incorporated
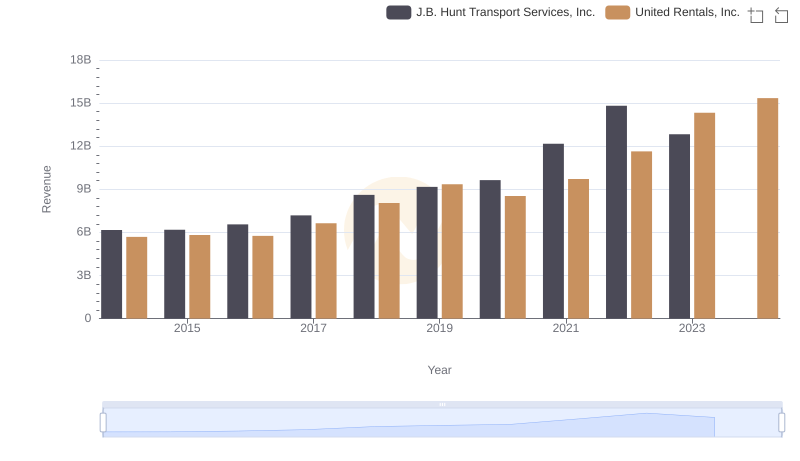
United Rentals, Inc. vs J.B. Hunt Transport Services, Inc.: Examining Key Revenue Metrics
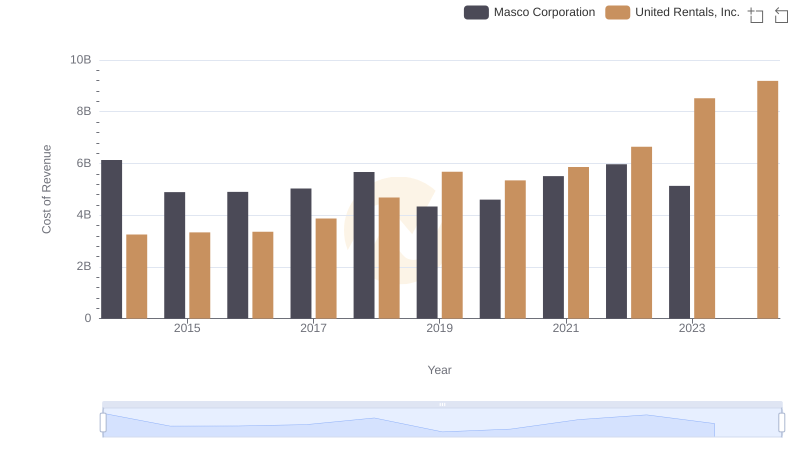
Comparing Cost of Revenue Efficiency: United Rentals, Inc. vs Masco Corporation
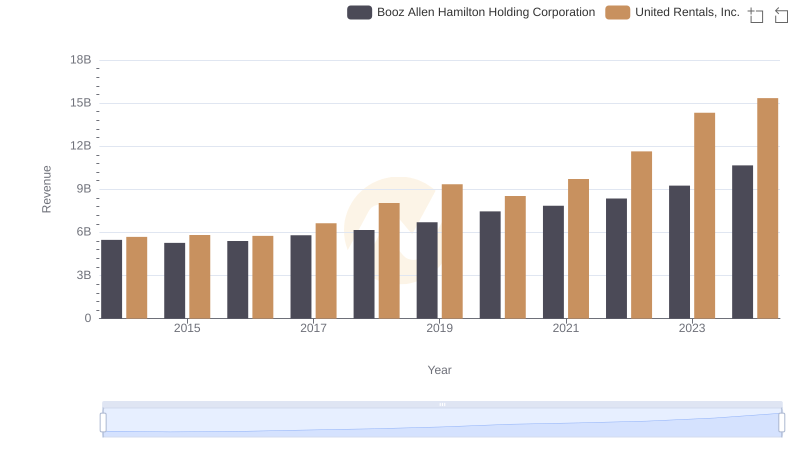
United Rentals, Inc. and Booz Allen Hamilton Holding Corporation: A Comprehensive Revenue Analysis
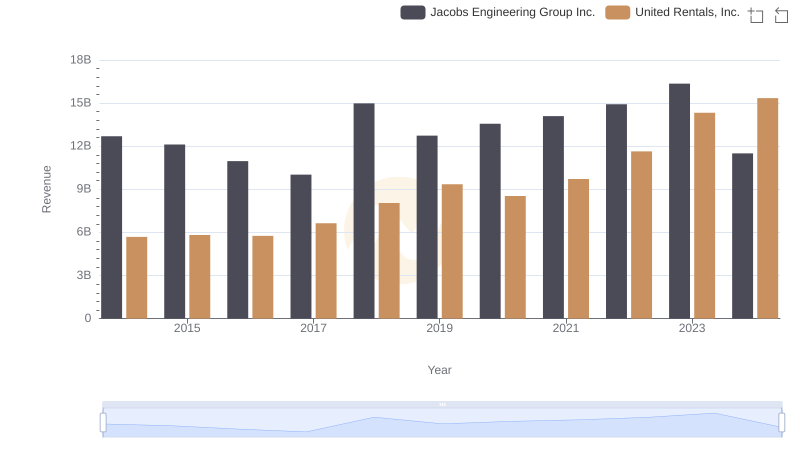
United Rentals, Inc. vs Jacobs Engineering Group Inc.: Annual Revenue Growth Compared
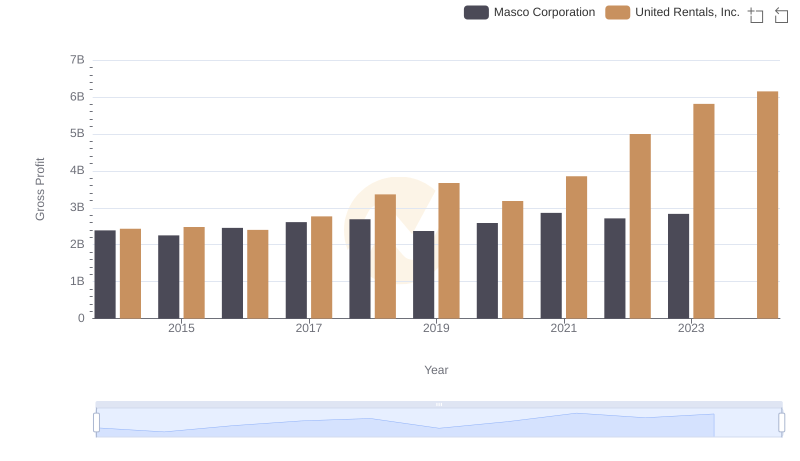
United Rentals, Inc. vs Masco Corporation: A Gross Profit Performance Breakdown
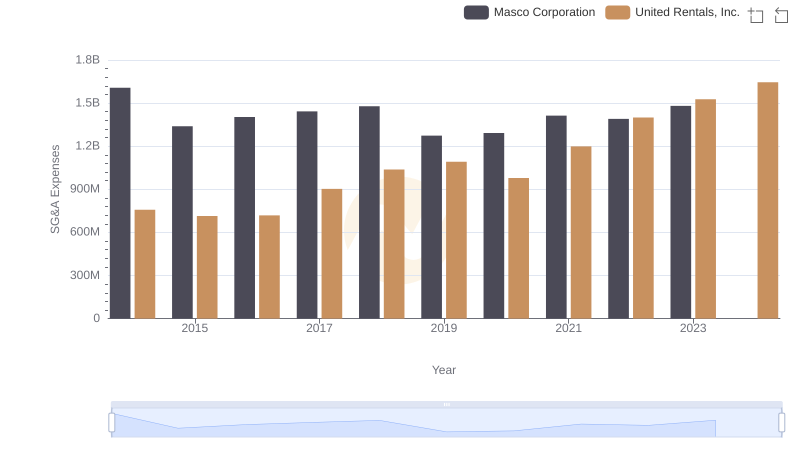
SG&A Efficiency Analysis: Comparing United Rentals, Inc. and Masco Corporation
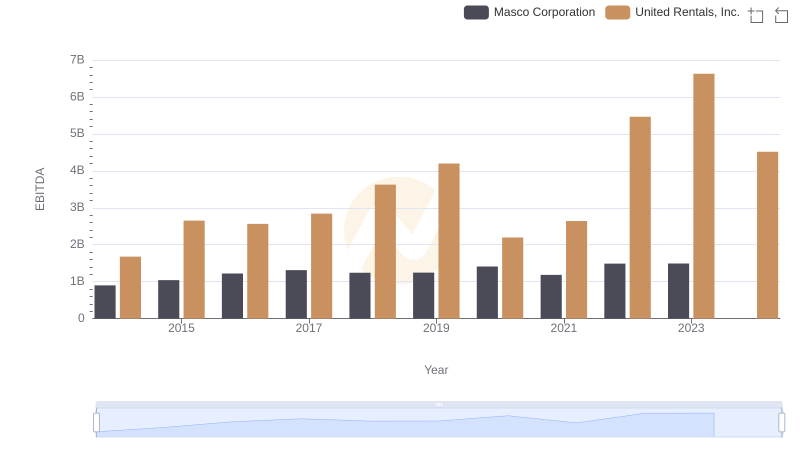
United Rentals, Inc. and Masco Corporation: A Detailed Examination of EBITDA Performance