| __timestamp | Masco Corporation | United Rentals, Inc. |
|---|---|---|
| Wednesday, January 1, 2014 | 6134000000 | 3253000000 |
| Thursday, January 1, 2015 | 4889000000 | 3337000000 |
| Friday, January 1, 2016 | 4901000000 | 3359000000 |
| Sunday, January 1, 2017 | 5033000000 | 3872000000 |
| Monday, January 1, 2018 | 5670000000 | 4683000000 |
| Tuesday, January 1, 2019 | 4336000000 | 5681000000 |
| Wednesday, January 1, 2020 | 4601000000 | 5347000000 |
| Friday, January 1, 2021 | 5512000000 | 5863000000 |
| Saturday, January 1, 2022 | 5967000000 | 6646000000 |
| Sunday, January 1, 2023 | 5131000000 | 8519000000 |
| Monday, January 1, 2024 | 4997000000 | 9195000000 |
Infusing magic into the data realm
In the ever-evolving landscape of industrial and home improvement sectors, United Rentals, Inc. and Masco Corporation stand as titans. Over the past decade, these companies have showcased distinct trajectories in their cost of revenue efficiency. From 2014 to 2023, Masco Corporation's cost of revenue fluctuated, peaking in 2014 and 2022, while United Rentals, Inc. demonstrated a consistent upward trend, culminating in a remarkable 162% increase by 2023. This divergence highlights United Rentals' strategic prowess in scaling operations efficiently, whereas Masco's performance reflects a more volatile market adaptation. Notably, 2023 marked a pivotal year, with United Rentals surpassing Masco by a staggering 66%. As we look to the future, the absence of Masco's 2024 data leaves room for speculation on its next strategic move. This analysis underscores the dynamic nature of cost management in competitive industries.
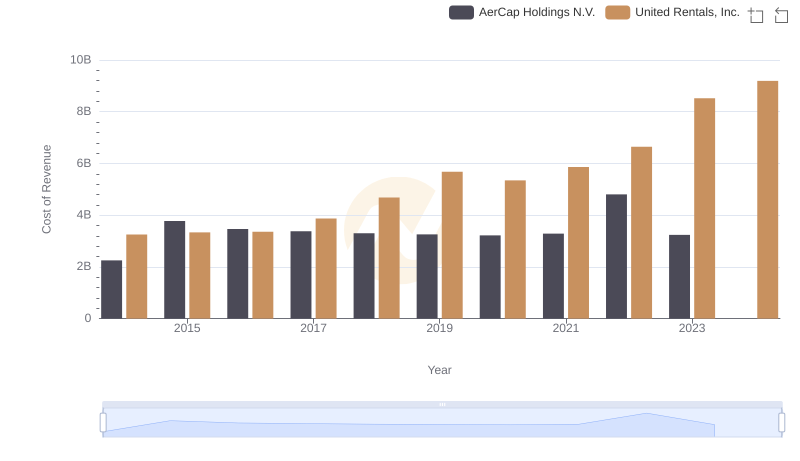
Cost Insights: Breaking Down United Rentals, Inc. and AerCap Holdings N.V.'s Expenses
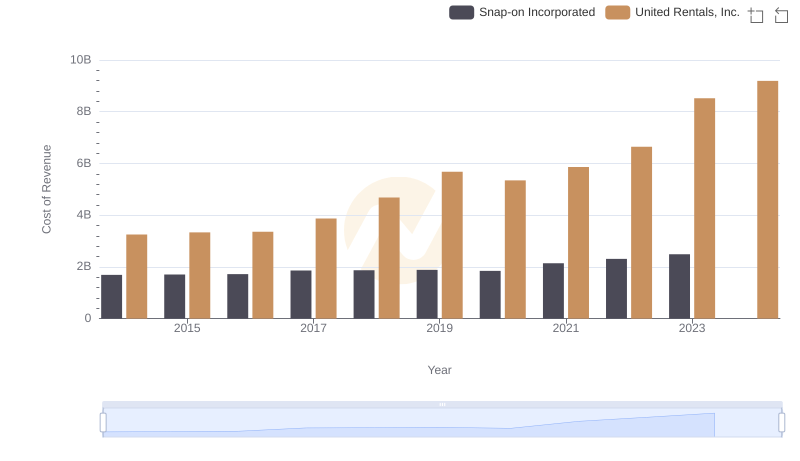
Cost Insights: Breaking Down United Rentals, Inc. and Snap-on Incorporated's Expenses
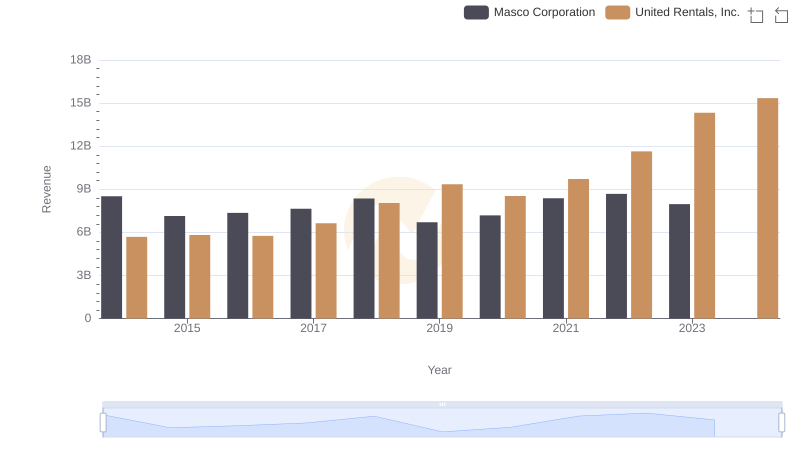
United Rentals, Inc. or Masco Corporation: Who Leads in Yearly Revenue?
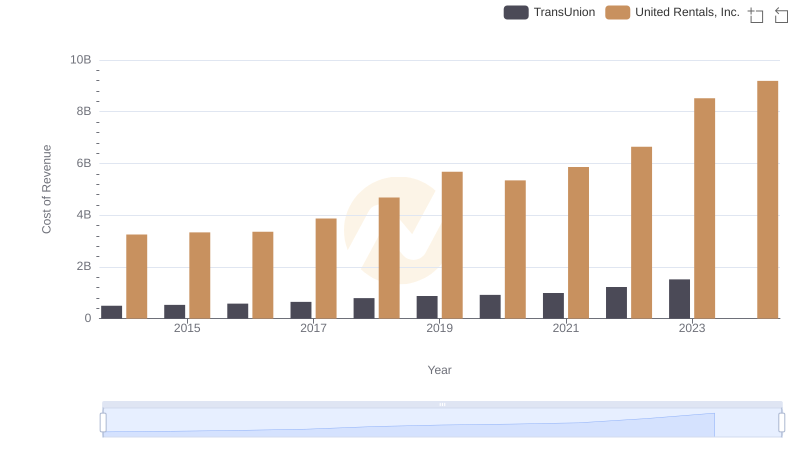
Cost of Revenue: Key Insights for United Rentals, Inc. and TransUnion
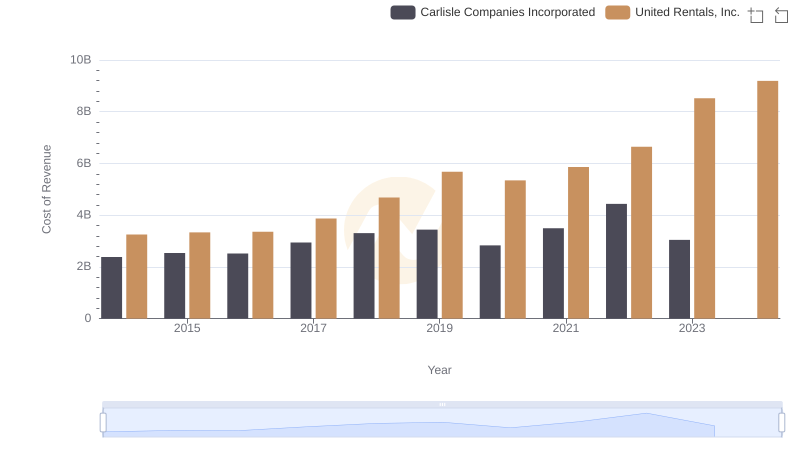
Analyzing Cost of Revenue: United Rentals, Inc. and Carlisle Companies Incorporated
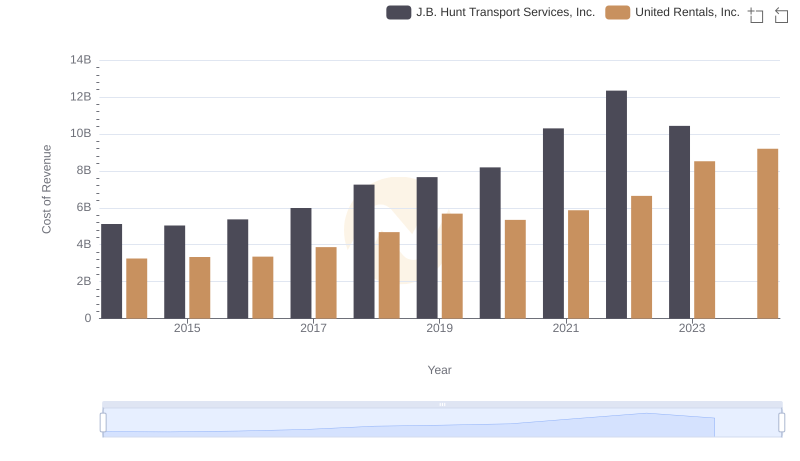
Cost of Revenue Comparison: United Rentals, Inc. vs J.B. Hunt Transport Services, Inc.
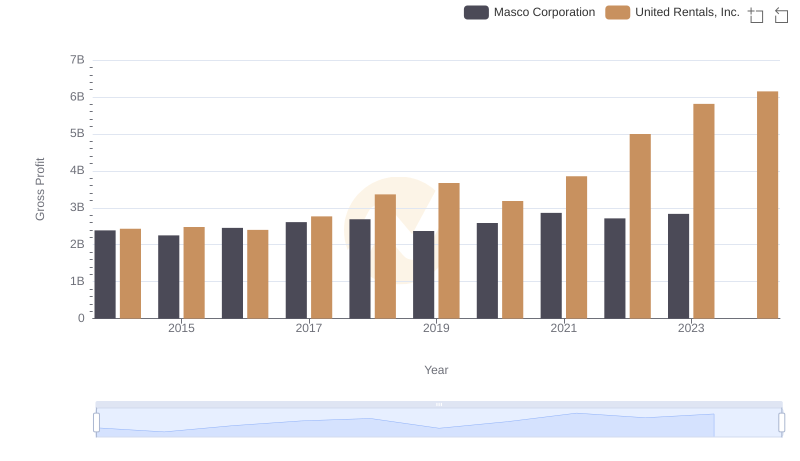
United Rentals, Inc. vs Masco Corporation: A Gross Profit Performance Breakdown
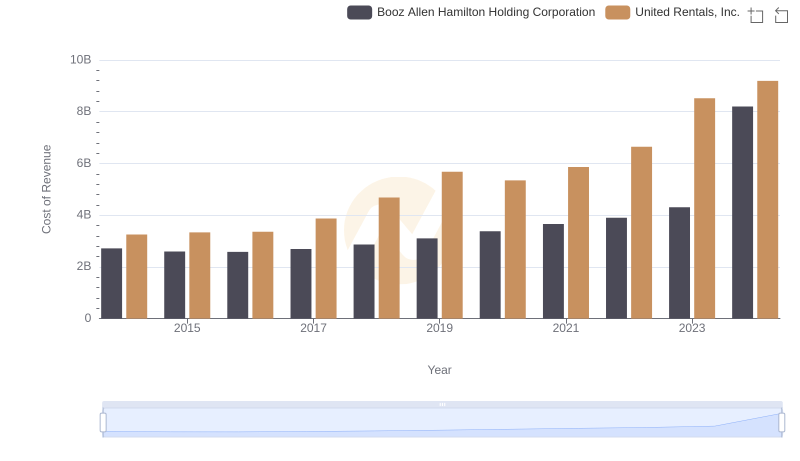
Cost of Revenue: Key Insights for United Rentals, Inc. and Booz Allen Hamilton Holding Corporation
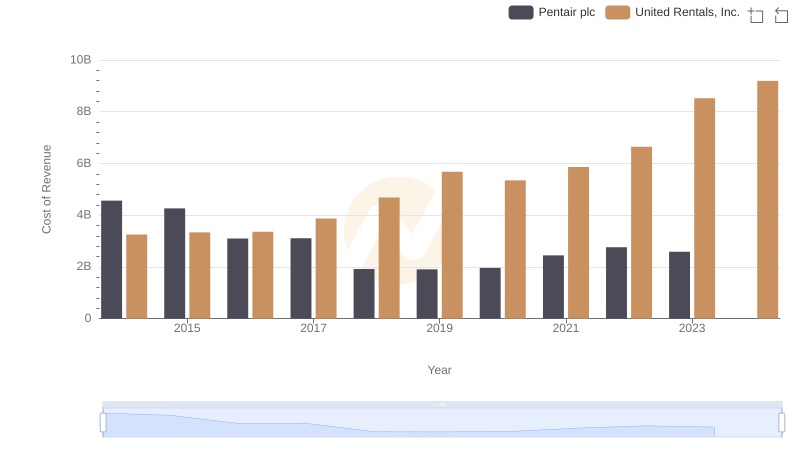
Analyzing Cost of Revenue: United Rentals, Inc. and Pentair plc
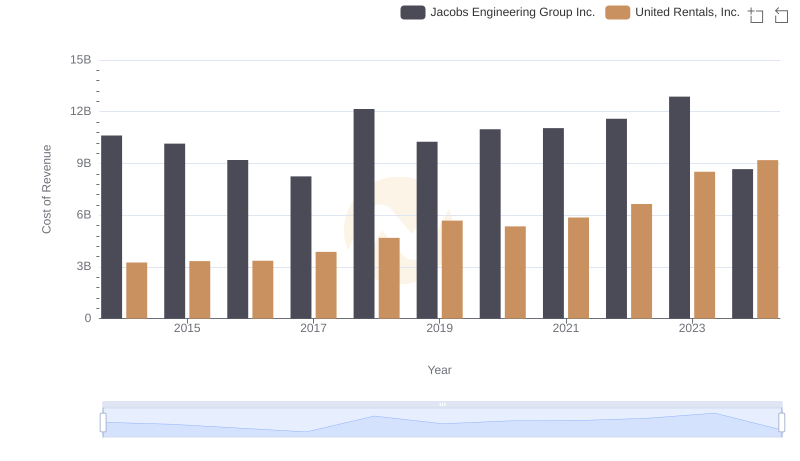
Cost Insights: Breaking Down United Rentals, Inc. and Jacobs Engineering Group Inc.'s Expenses
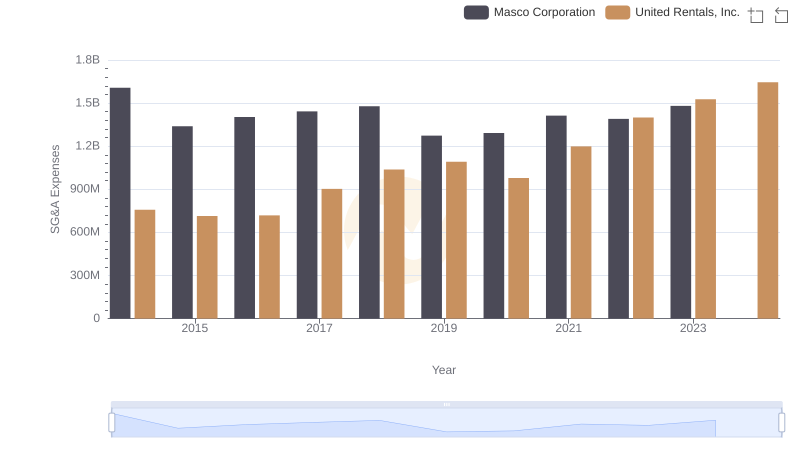
SG&A Efficiency Analysis: Comparing United Rentals, Inc. and Masco Corporation
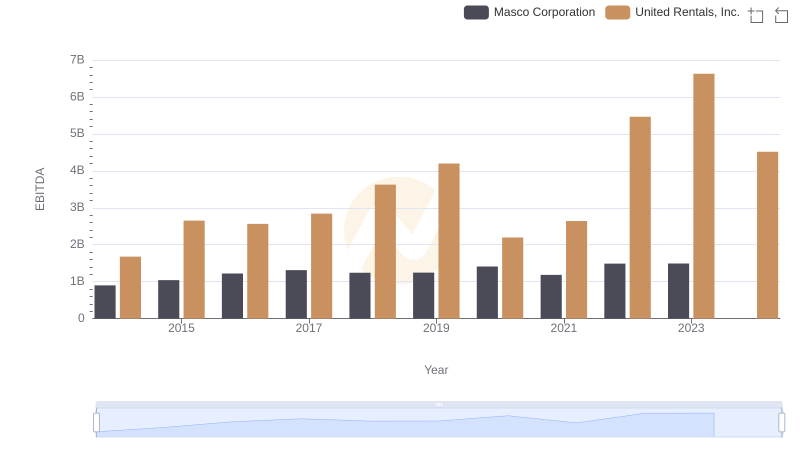
United Rentals, Inc. and Masco Corporation: A Detailed Examination of EBITDA Performance