| __timestamp | Pentair plc | United Rentals, Inc. |
|---|---|---|
| Wednesday, January 1, 2014 | 1493800000 | 758000000 |
| Thursday, January 1, 2015 | 1334300000 | 714000000 |
| Friday, January 1, 2016 | 979300000 | 719000000 |
| Sunday, January 1, 2017 | 1032500000 | 903000000 |
| Monday, January 1, 2018 | 534300000 | 1038000000 |
| Tuesday, January 1, 2019 | 540100000 | 1092000000 |
| Wednesday, January 1, 2020 | 520500000 | 979000000 |
| Friday, January 1, 2021 | 596400000 | 1199000000 |
| Saturday, January 1, 2022 | 677100000 | 1400000000 |
| Sunday, January 1, 2023 | 680200000 | 1527000000 |
| Monday, January 1, 2024 | 701400000 | 1645000000 |
Unleashing insights
In the ever-evolving landscape of corporate finance, understanding the trends in Selling, General, and Administrative (SG&A) expenses is crucial for investors and analysts alike. Over the past decade, United Rentals, Inc. and Pentair plc have showcased distinct trajectories in their SG&A expenditures.
From 2014 to 2023, United Rentals, Inc. has seen a steady increase in SG&A expenses, peaking at approximately 1.53 billion in 2023, marking a 102% rise from 2014. In contrast, Pentair plc experienced a significant decline, with expenses dropping by 54% from their 2014 peak of 1.49 billion to around 680 million in 2023.
This divergence highlights differing strategic priorities and operational efficiencies. While United Rentals, Inc. has expanded its operational footprint, Pentair plc has streamlined its operations, reflecting a shift towards leaner business models. Understanding these trends provides valuable insights into each company's strategic direction and financial health.
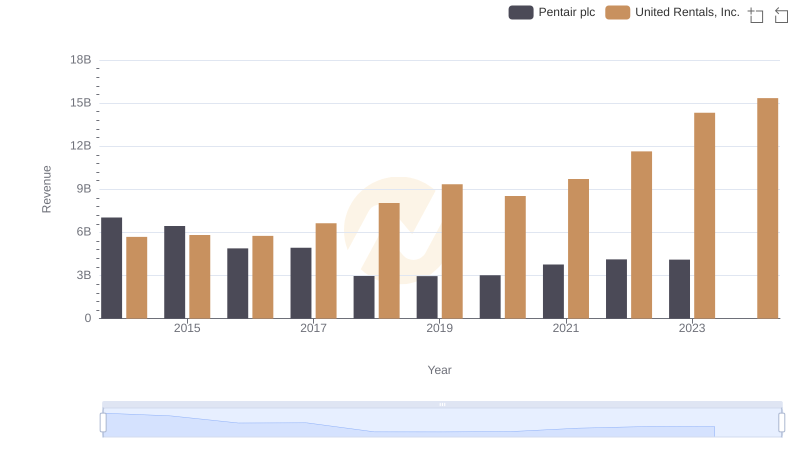
Revenue Showdown: United Rentals, Inc. vs Pentair plc
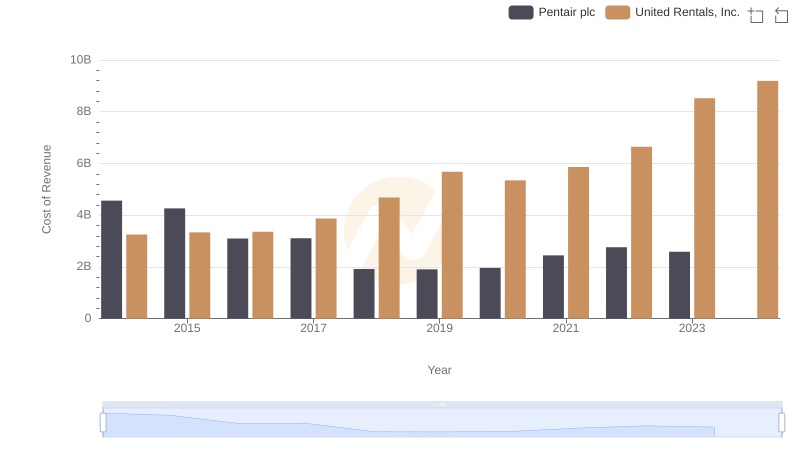
Analyzing Cost of Revenue: United Rentals, Inc. and Pentair plc
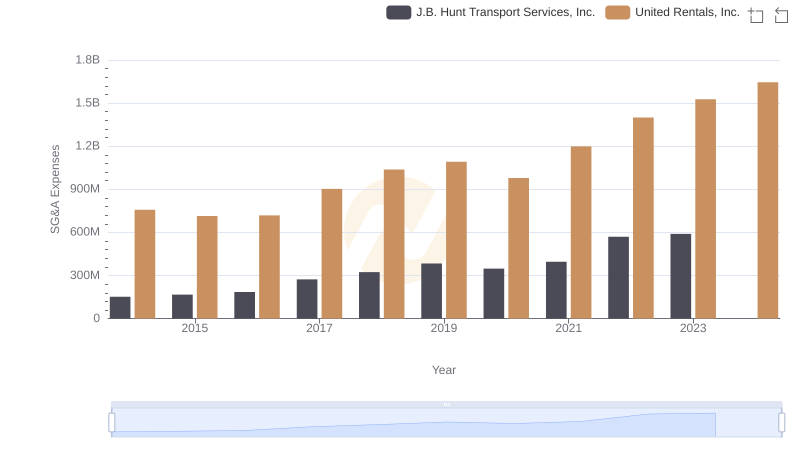
Breaking Down SG&A Expenses: United Rentals, Inc. vs J.B. Hunt Transport Services, Inc.
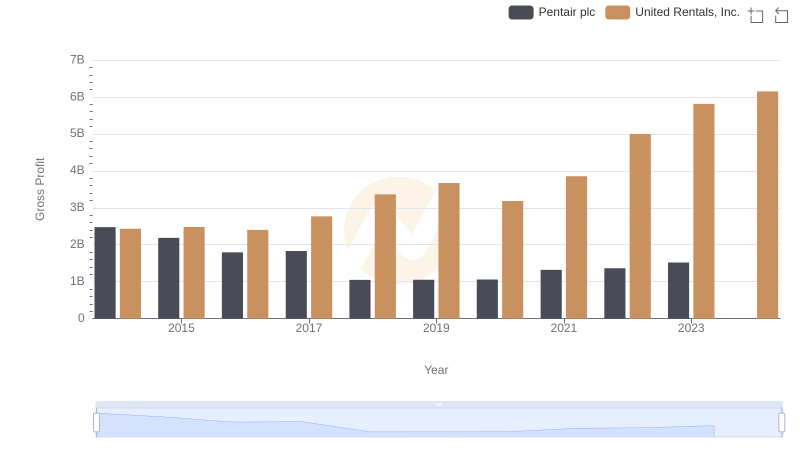
Who Generates Higher Gross Profit? United Rentals, Inc. or Pentair plc
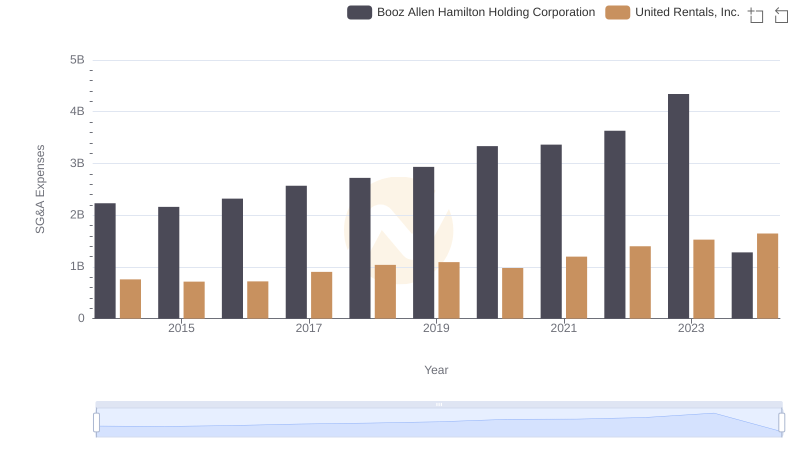
United Rentals, Inc. and Booz Allen Hamilton Holding Corporation: SG&A Spending Patterns Compared
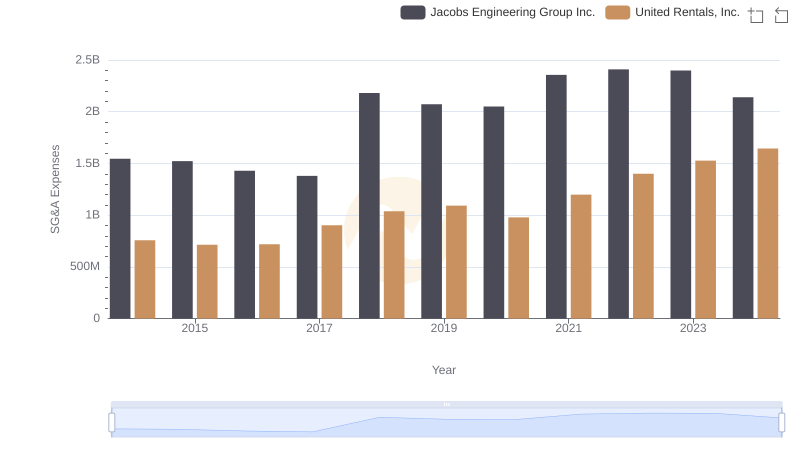
Who Optimizes SG&A Costs Better? United Rentals, Inc. or Jacobs Engineering Group Inc.
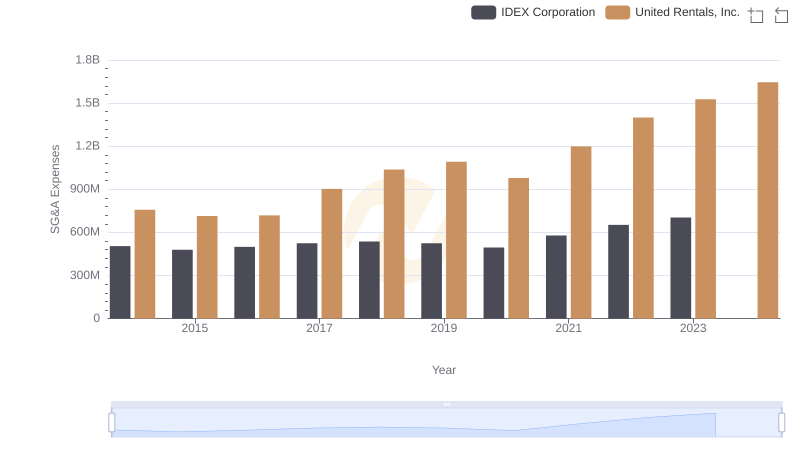
United Rentals, Inc. and IDEX Corporation: SG&A Spending Patterns Compared
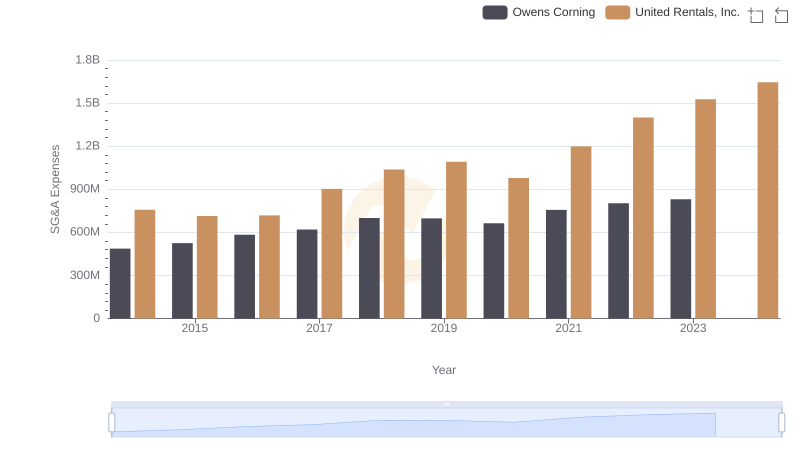
Breaking Down SG&A Expenses: United Rentals, Inc. vs Owens Corning
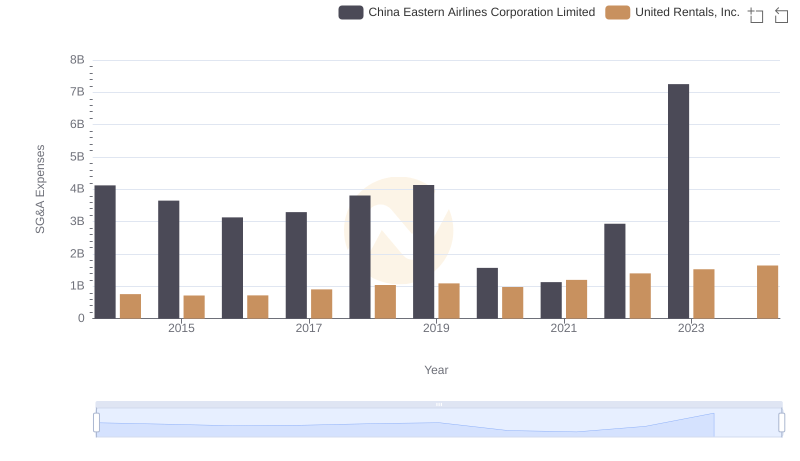
United Rentals, Inc. or China Eastern Airlines Corporation Limited: Who Manages SG&A Costs Better?
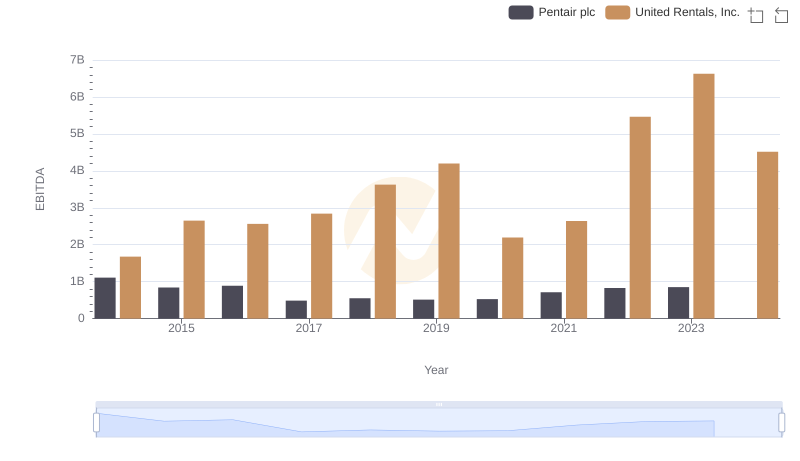
Comprehensive EBITDA Comparison: United Rentals, Inc. vs Pentair plc
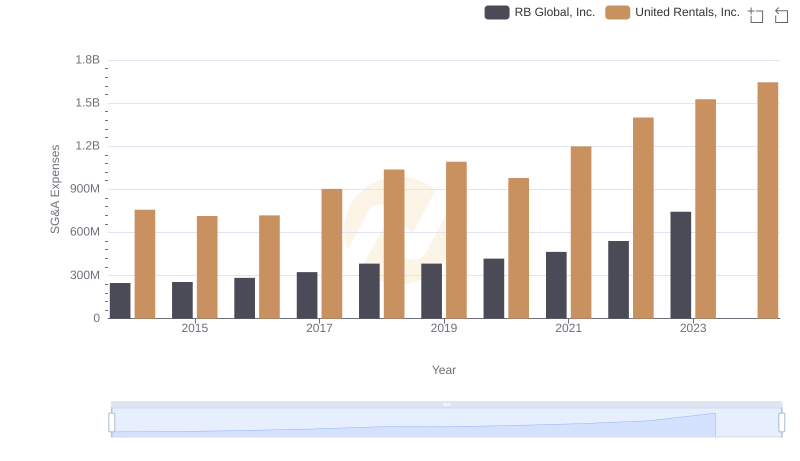
United Rentals, Inc. and RB Global, Inc.: SG&A Spending Patterns Compared

Breaking Down SG&A Expenses: United Rentals, Inc. vs Expeditors International of Washington, Inc.