| __timestamp | Snap-on Incorporated | United Rentals, Inc. |
|---|---|---|
| Wednesday, January 1, 2014 | 1047900000 | 758000000 |
| Thursday, January 1, 2015 | 1009100000 | 714000000 |
| Friday, January 1, 2016 | 1001400000 | 719000000 |
| Sunday, January 1, 2017 | 1101300000 | 903000000 |
| Monday, January 1, 2018 | 1080700000 | 1038000000 |
| Tuesday, January 1, 2019 | 1071500000 | 1092000000 |
| Wednesday, January 1, 2020 | 1054800000 | 979000000 |
| Friday, January 1, 2021 | 1202300000 | 1199000000 |
| Saturday, January 1, 2022 | 1181200000 | 1400000000 |
| Sunday, January 1, 2023 | 1249000000 | 1527000000 |
| Monday, January 1, 2024 | 0 | 1645000000 |
Infusing magic into the data realm
In the competitive landscape of industrial services, understanding spending patterns is crucial. Over the past decade, United Rentals, Inc. and Snap-on Incorporated have shown distinct trends in their Selling, General, and Administrative (SG&A) expenses. From 2014 to 2023, Snap-on's SG&A expenses have grown by approximately 19%, peaking in 2023. Meanwhile, United Rentals has seen a more dramatic increase of about 101% over the same period, with a notable surge in 2023. This divergence highlights United Rentals' aggressive expansion strategy compared to Snap-on's steady growth. Interestingly, data for 2024 is incomplete, leaving room for speculation on future trends. As these companies navigate economic shifts, their SG&A strategies will be pivotal in maintaining competitive edges. Stay tuned for more insights as we continue to track these industry giants.
Note: Data for 2024 is partially unavailable, indicating potential updates in the future.
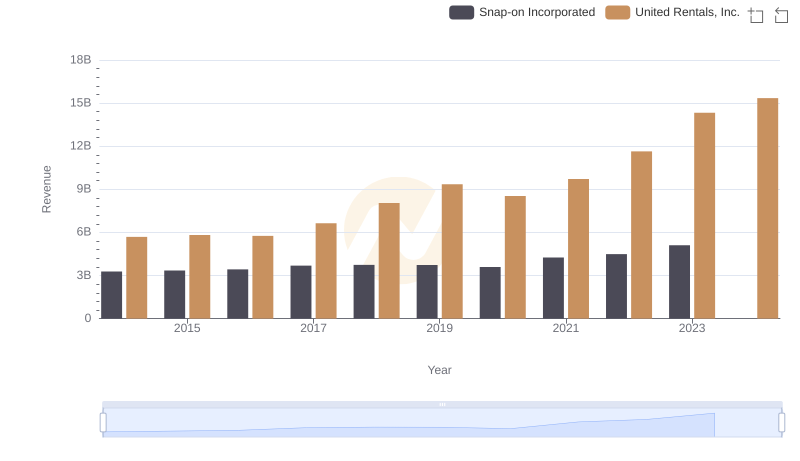
Breaking Down Revenue Trends: United Rentals, Inc. vs Snap-on Incorporated
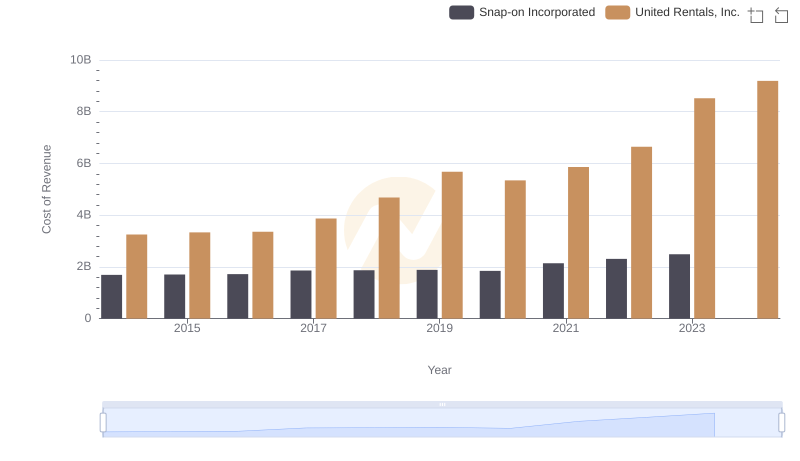
Cost Insights: Breaking Down United Rentals, Inc. and Snap-on Incorporated's Expenses
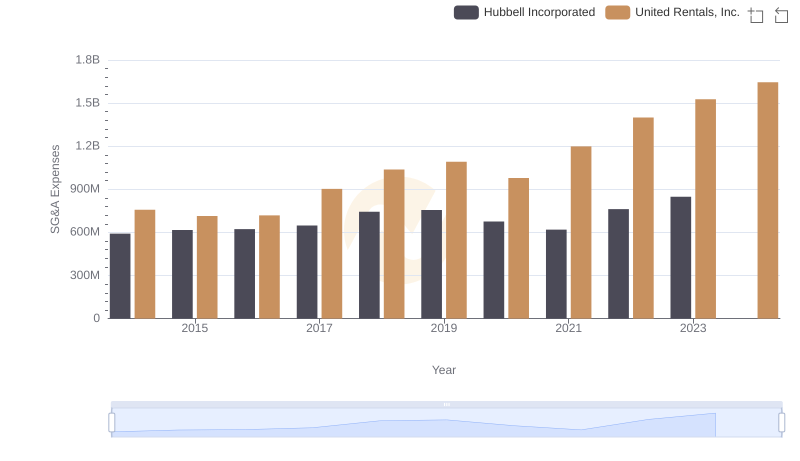
Who Optimizes SG&A Costs Better? United Rentals, Inc. or Hubbell Incorporated
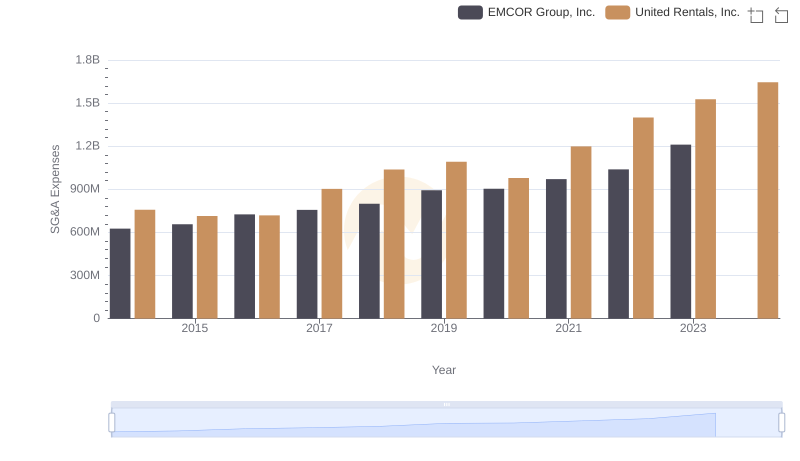
SG&A Efficiency Analysis: Comparing United Rentals, Inc. and EMCOR Group, Inc.
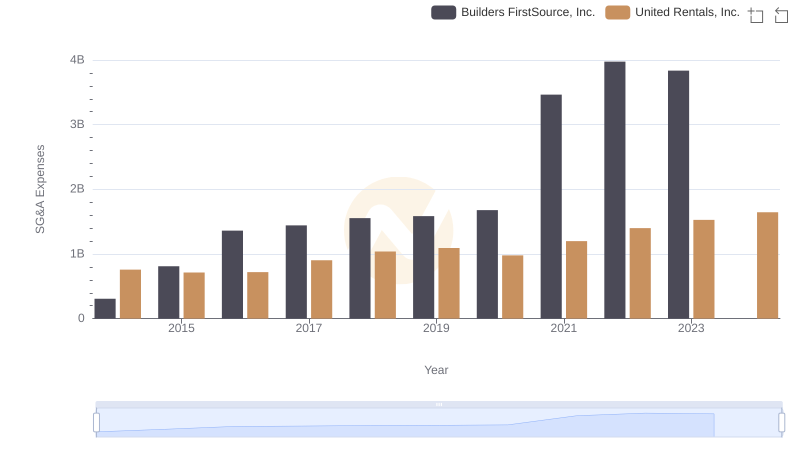
Who Optimizes SG&A Costs Better? United Rentals, Inc. or Builders FirstSource, Inc.
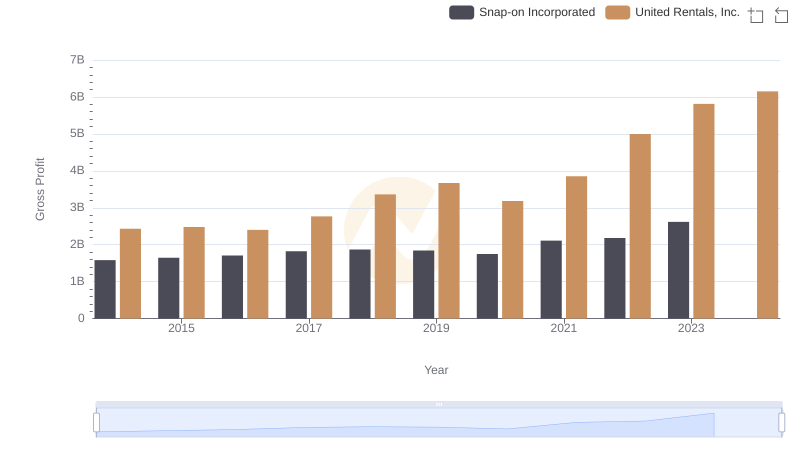
Gross Profit Analysis: Comparing United Rentals, Inc. and Snap-on Incorporated
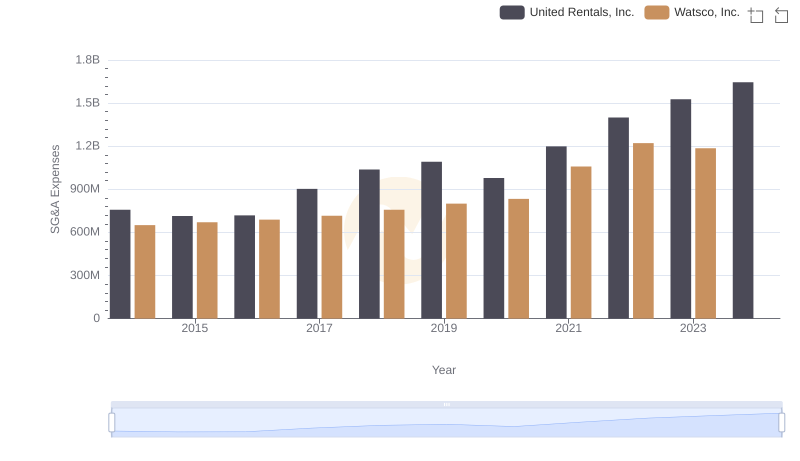
Cost Management Insights: SG&A Expenses for United Rentals, Inc. and Watsco, Inc.
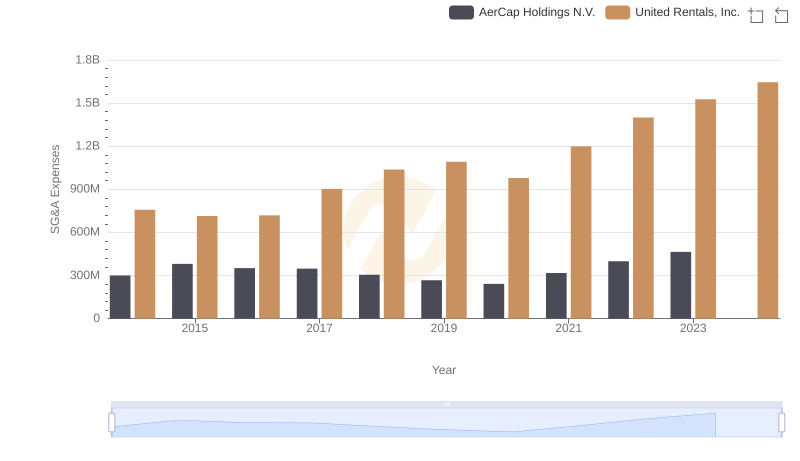
Cost Management Insights: SG&A Expenses for United Rentals, Inc. and AerCap Holdings N.V.
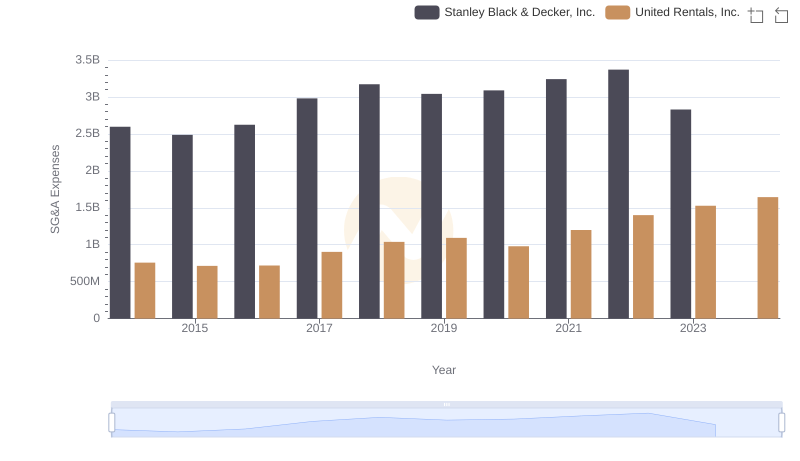
Selling, General, and Administrative Costs: United Rentals, Inc. vs Stanley Black & Decker, Inc.
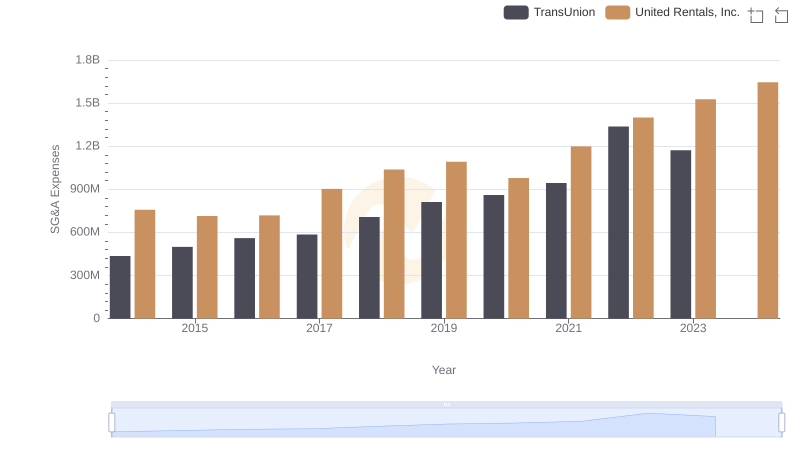
Breaking Down SG&A Expenses: United Rentals, Inc. vs TransUnion
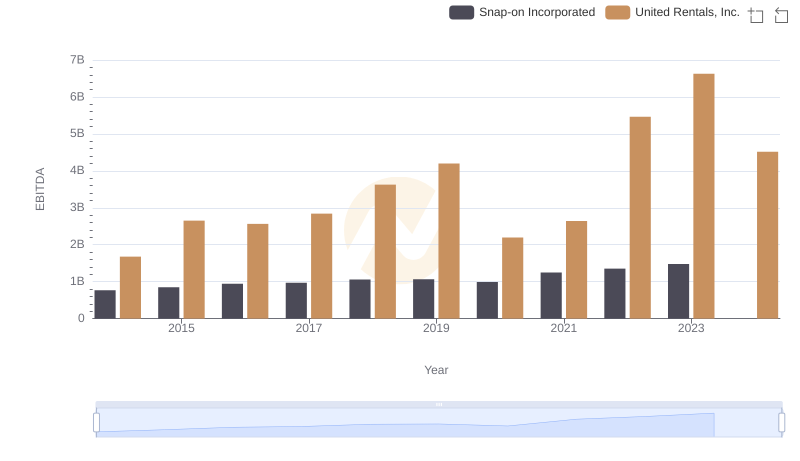
Comparative EBITDA Analysis: United Rentals, Inc. vs Snap-on Incorporated
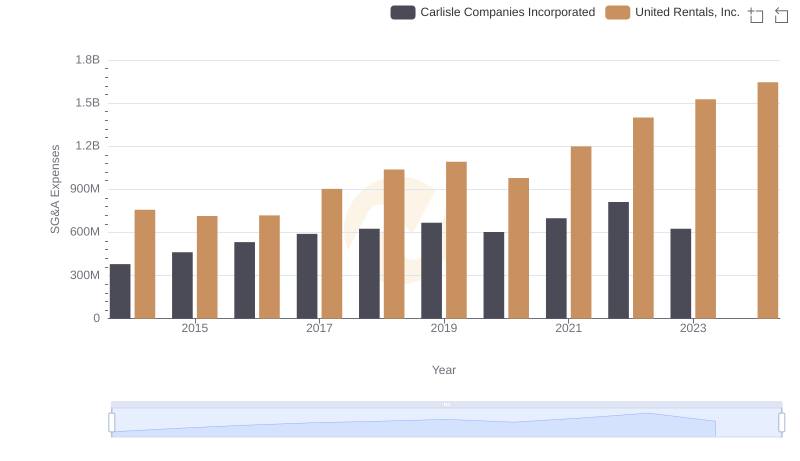
Who Optimizes SG&A Costs Better? United Rentals, Inc. or Carlisle Companies Incorporated