| __timestamp | Stanley Black & Decker, Inc. | United Rentals, Inc. |
|---|---|---|
| Wednesday, January 1, 2014 | 2595900000 | 758000000 |
| Thursday, January 1, 2015 | 2486400000 | 714000000 |
| Friday, January 1, 2016 | 2623900000 | 719000000 |
| Sunday, January 1, 2017 | 2980100000 | 903000000 |
| Monday, January 1, 2018 | 3171700000 | 1038000000 |
| Tuesday, January 1, 2019 | 3041000000 | 1092000000 |
| Wednesday, January 1, 2020 | 3089600000 | 979000000 |
| Friday, January 1, 2021 | 3240400000 | 1199000000 |
| Saturday, January 1, 2022 | 3370000000 | 1400000000 |
| Sunday, January 1, 2023 | 2829300000 | 1527000000 |
| Monday, January 1, 2024 | 3310500000 | 1645000000 |
Unlocking the unknown
In the competitive landscape of industrial equipment and tools, United Rentals, Inc. and Stanley Black & Decker, Inc. have been pivotal players. Over the past decade, their Selling, General, and Administrative (SG&A) expenses have revealed intriguing trends. From 2014 to 2023, Stanley Black & Decker's SG&A costs have consistently been higher, peaking in 2022 with a 30% increase from 2014. Meanwhile, United Rentals has shown a steady rise, with a notable 113% increase in 2023 compared to 2014. This growth trajectory highlights United Rentals' aggressive expansion strategy. However, 2024 data for Stanley Black & Decker is missing, leaving room for speculation. As these companies navigate economic challenges, their SG&A expenses offer a window into their operational strategies and market positioning.
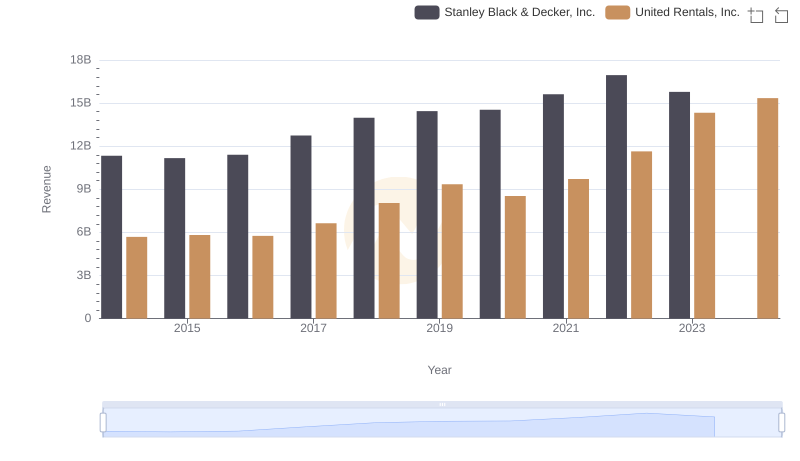
Comparing Revenue Performance: United Rentals, Inc. or Stanley Black & Decker, Inc.?
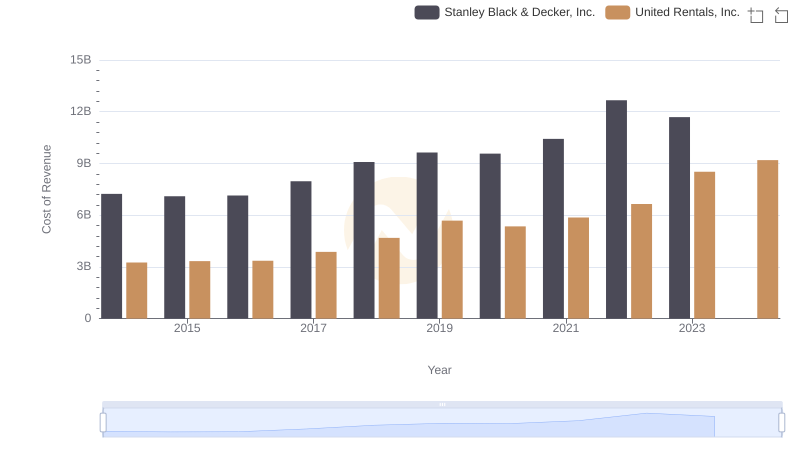
Cost of Revenue Comparison: United Rentals, Inc. vs Stanley Black & Decker, Inc.
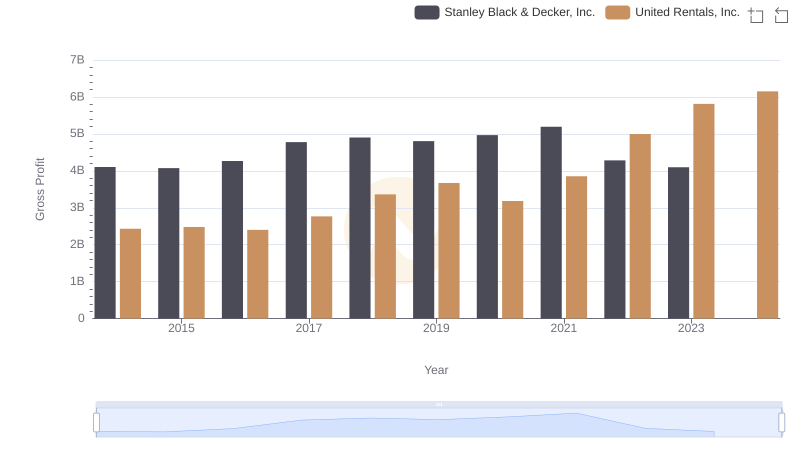
Gross Profit Analysis: Comparing United Rentals, Inc. and Stanley Black & Decker, Inc.
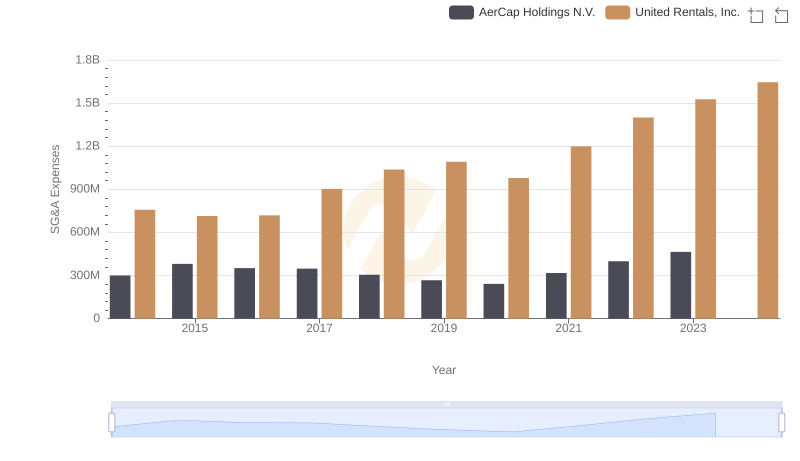
Cost Management Insights: SG&A Expenses for United Rentals, Inc. and AerCap Holdings N.V.
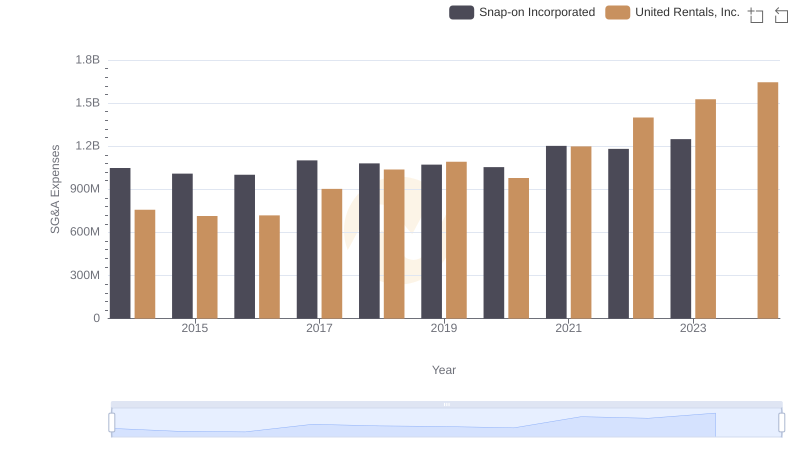
United Rentals, Inc. and Snap-on Incorporated: SG&A Spending Patterns Compared
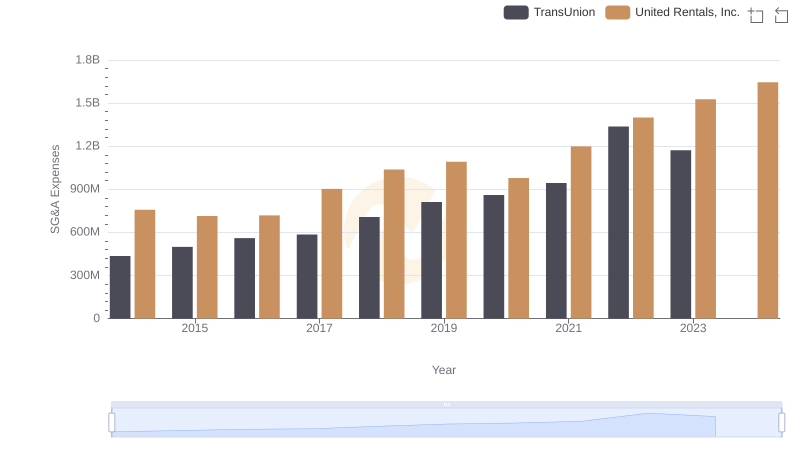
Breaking Down SG&A Expenses: United Rentals, Inc. vs TransUnion
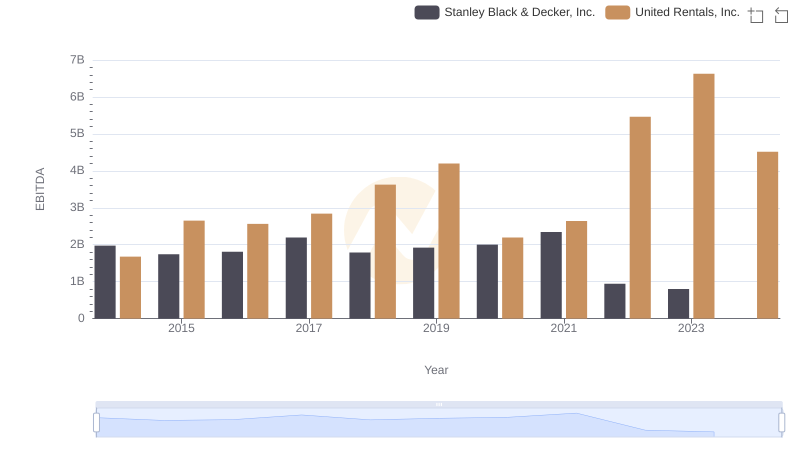
A Side-by-Side Analysis of EBITDA: United Rentals, Inc. and Stanley Black & Decker, Inc.

Breaking Down Revenue Trends: United Rentals, Inc. vs Stanley Black & Decker, Inc.

Comparing Cost of Revenue Efficiency: United Rentals, Inc. vs Stanley Black & Decker, Inc.

United Rentals, Inc. and Stanley Black & Decker, Inc.: A Detailed Gross Profit Analysis
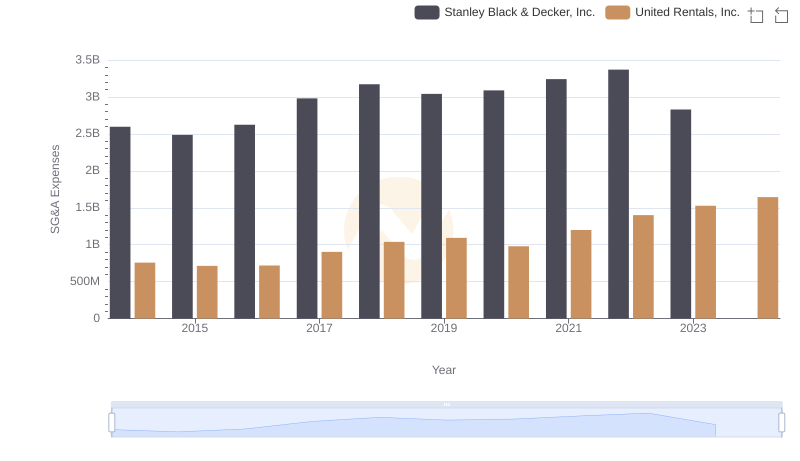
Cost Management Insights: SG&A Expenses for United Rentals, Inc. and Stanley Black & Decker, Inc.

Comprehensive EBITDA Comparison: United Rentals, Inc. vs Stanley Black & Decker, Inc.