| __timestamp | Masco Corporation | United Rentals, Inc. |
|---|---|---|
| Wednesday, January 1, 2014 | 2387000000 | 2432000000 |
| Thursday, January 1, 2015 | 2253000000 | 2480000000 |
| Friday, January 1, 2016 | 2456000000 | 2403000000 |
| Sunday, January 1, 2017 | 2611000000 | 2769000000 |
| Monday, January 1, 2018 | 2689000000 | 3364000000 |
| Tuesday, January 1, 2019 | 2371000000 | 3670000000 |
| Wednesday, January 1, 2020 | 2587000000 | 3183000000 |
| Friday, January 1, 2021 | 2863000000 | 3853000000 |
| Saturday, January 1, 2022 | 2713000000 | 4996000000 |
| Sunday, January 1, 2023 | 2836000000 | 5813000000 |
| Monday, January 1, 2024 | 2831000000 | 6150000000 |
Unlocking the unknown
In the competitive landscape of industrial and construction services, United Rentals, Inc. and Masco Corporation have been pivotal players. Over the past decade, United Rentals has consistently outperformed Masco in terms of gross profit, showcasing a robust growth trajectory. From 2014 to 2023, United Rentals' gross profit surged by approximately 139%, peaking at $5.8 billion in 2023. In contrast, Masco Corporation's growth was more modest, with a 19% increase, reaching $2.8 billion in the same year.
The data highlights a significant divergence in performance, with United Rentals capitalizing on market opportunities more effectively. The absence of data for Masco in 2024 suggests a potential gap in reporting or a strategic shift. As the industry evolves, these insights provide a glimpse into the strategic maneuvers of these industry titans.
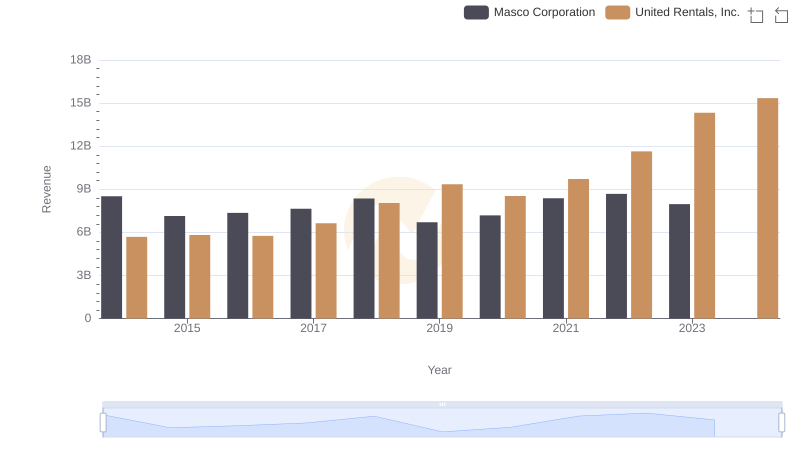
United Rentals, Inc. or Masco Corporation: Who Leads in Yearly Revenue?
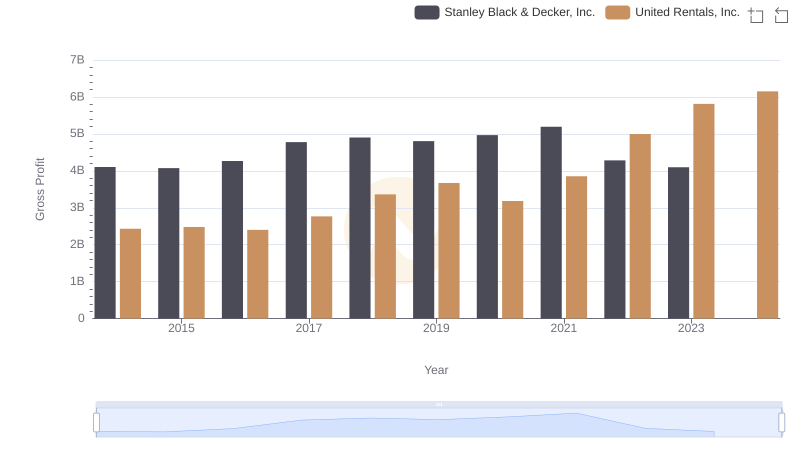
Gross Profit Analysis: Comparing United Rentals, Inc. and Stanley Black & Decker, Inc.
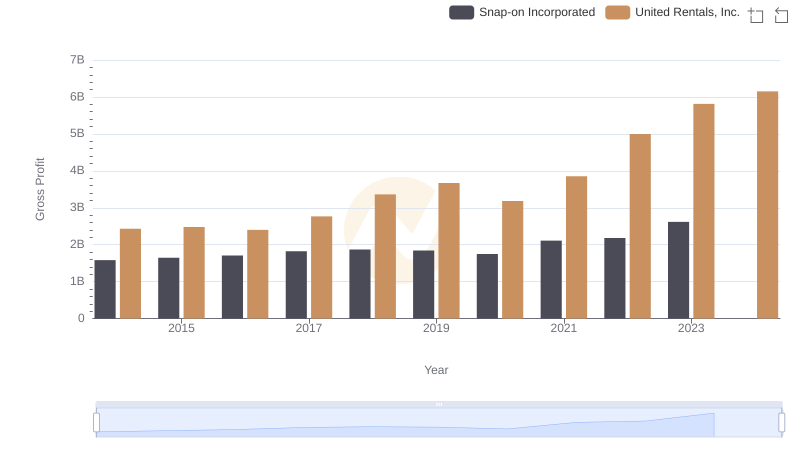
Gross Profit Analysis: Comparing United Rentals, Inc. and Snap-on Incorporated
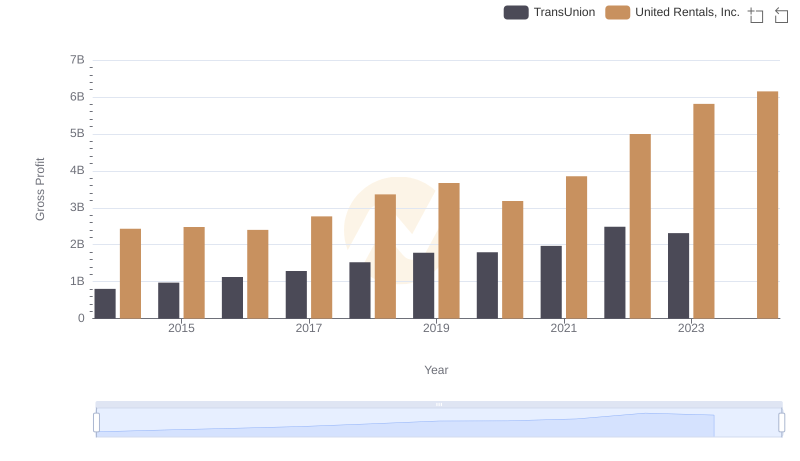
United Rentals, Inc. and TransUnion: A Detailed Gross Profit Analysis
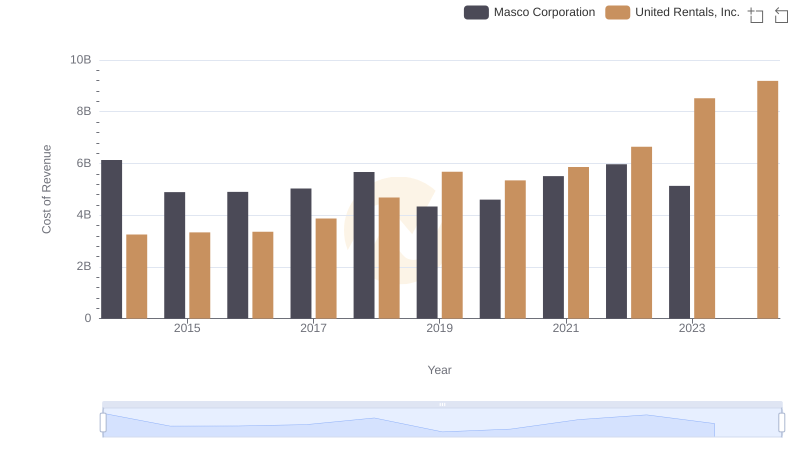
Comparing Cost of Revenue Efficiency: United Rentals, Inc. vs Masco Corporation
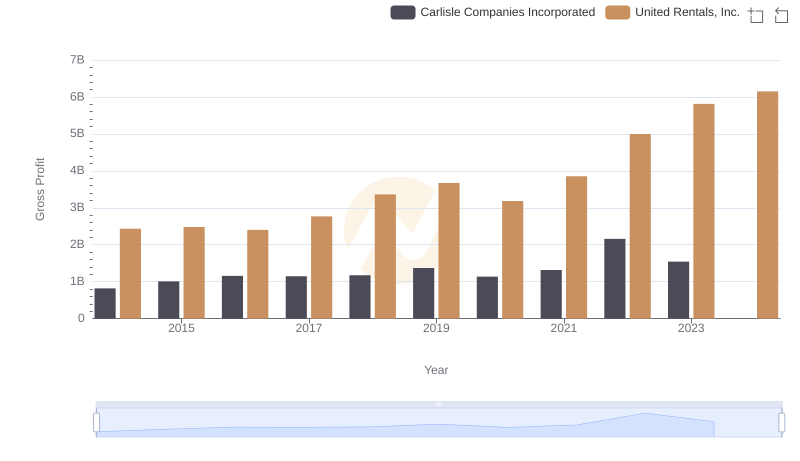
Gross Profit Comparison: United Rentals, Inc. and Carlisle Companies Incorporated Trends
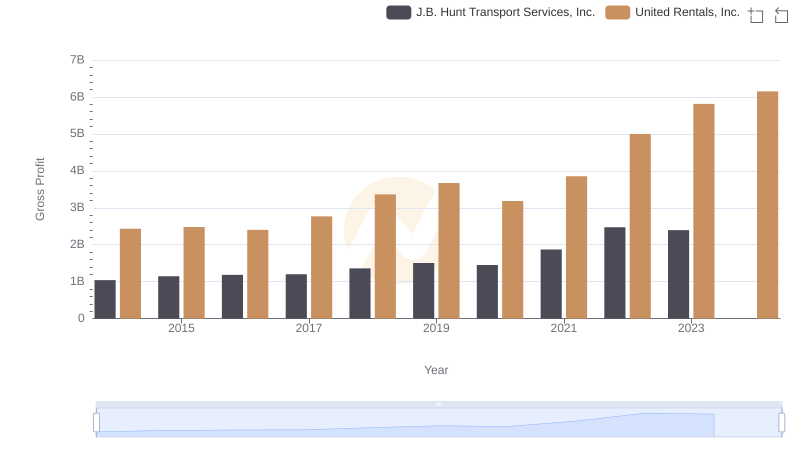
Gross Profit Comparison: United Rentals, Inc. and J.B. Hunt Transport Services, Inc. Trends
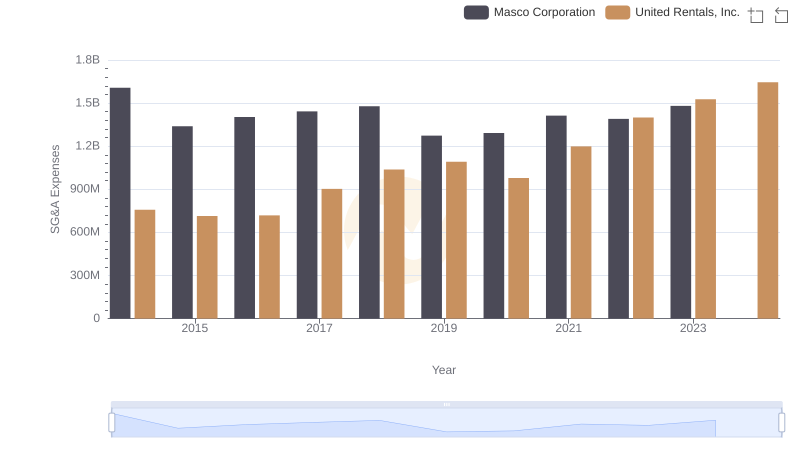
SG&A Efficiency Analysis: Comparing United Rentals, Inc. and Masco Corporation
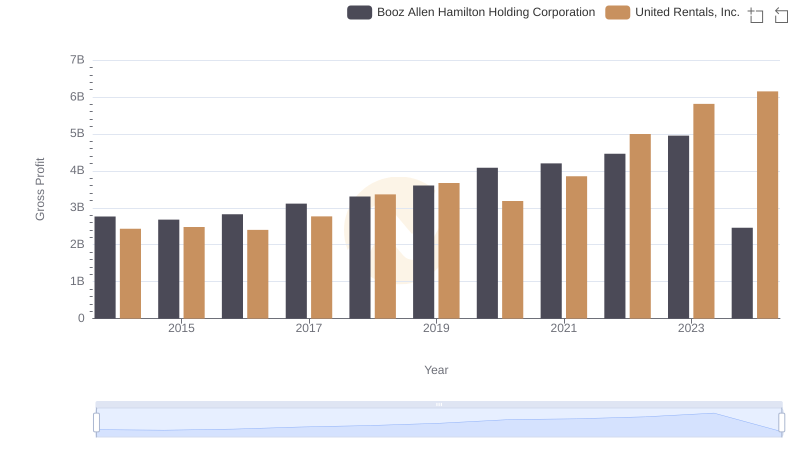
Gross Profit Comparison: United Rentals, Inc. and Booz Allen Hamilton Holding Corporation Trends
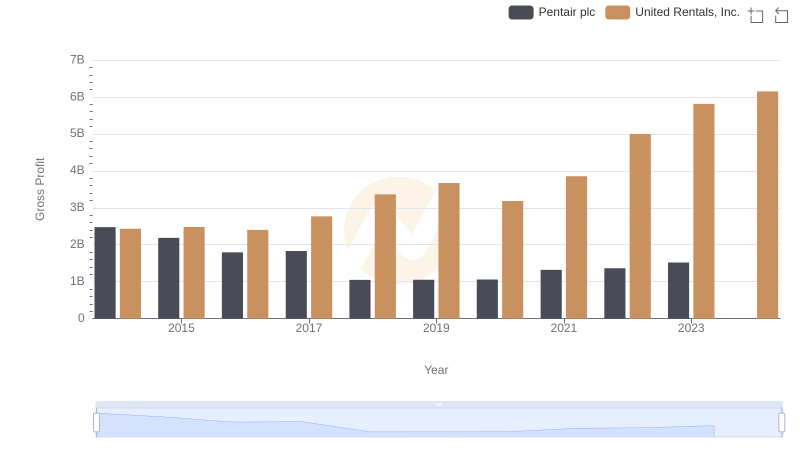
Who Generates Higher Gross Profit? United Rentals, Inc. or Pentair plc
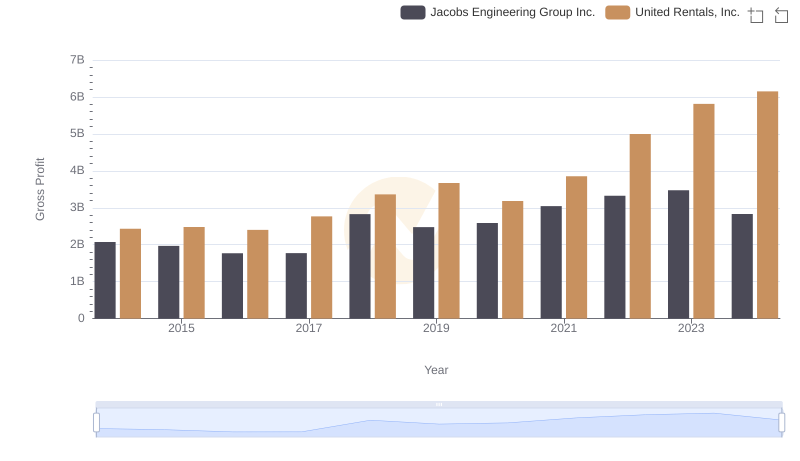
United Rentals, Inc. and Jacobs Engineering Group Inc.: A Detailed Gross Profit Analysis
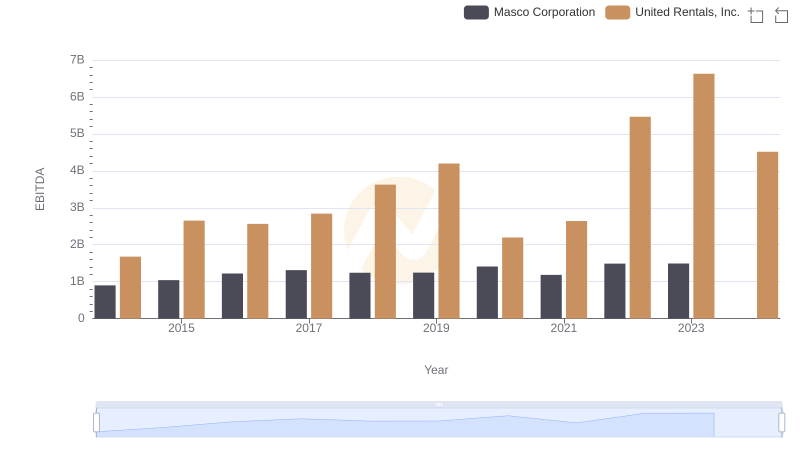
United Rentals, Inc. and Masco Corporation: A Detailed Examination of EBITDA Performance