| __timestamp | J.B. Hunt Transport Services, Inc. | United Rentals, Inc. |
|---|---|---|
| Wednesday, January 1, 2014 | 152469000 | 758000000 |
| Thursday, January 1, 2015 | 166799000 | 714000000 |
| Friday, January 1, 2016 | 185436000 | 719000000 |
| Sunday, January 1, 2017 | 273440000 | 903000000 |
| Monday, January 1, 2018 | 323587000 | 1038000000 |
| Tuesday, January 1, 2019 | 383981000 | 1092000000 |
| Wednesday, January 1, 2020 | 348076000 | 979000000 |
| Friday, January 1, 2021 | 395533000 | 1199000000 |
| Saturday, January 1, 2022 | 570191000 | 1400000000 |
| Sunday, January 1, 2023 | 590242000 | 1527000000 |
| Monday, January 1, 2024 | 1645000000 |
Cracking the code
In the competitive landscape of American corporations, the management of Selling, General, and Administrative (SG&A) expenses plays a pivotal role in determining a company's profitability and operational efficiency. SG&A expenses encompass a wide range of costs, including salaries, advertising, and overhead, which are essential for running day-to-day operations but do not directly contribute to producing goods or services. Understanding how these expenses evolve over time can provide valuable insights into a company's strategic priorities and financial health.
The data spans from 2014 to 2023, showcasing the SG&A expenses of two prominent companies: United Rentals, Inc. and J.B. Hunt Transport Services, Inc. This period is significant as it encompasses various economic conditions, including recovery from the 2008 financial crisis, the COVID-19 pandemic, and the subsequent economic rebound.
From 2014 to 2023, J.B. Hunt's SG&A expenses exhibited a steady upward trajectory. In 2014, the company reported approximately $152 million in SG&A expenses, which surged to about $590 million by 2023. This represents an impressive increase of nearly 287% over the decade, highlighting J.B. Hunt's aggressive growth strategy in the transportation sector.
In contrast, United Rentals, Inc. started with SG&A expenses of around $758 million in 2014, which also grew significantly, reaching approximately $1.645 billion in 2023. This growth translates to an increase of about 117%, indicating a robust expansion in their rental services and a strategic focus on enhancing operational capabilities.
When comparing the two companies, United Rentals consistently maintained higher SG&A expenses than J.B. Hunt throughout the analyzed period. For instance, in 2023, United Rentals' SG&A expenses were nearly 2.8 times greater than those of J.B. Hunt. This disparity raises questions about the different business models and operational strategies employed by these companies.
While J.B. Hunt's growth in SG&A expenses may reflect its investments in technology and logistics to enhance service delivery, United Rentals' higher expenses could be attributed to its extensive network of rental locations and the associated overhead costs.
It's worth noting that there are gaps in the data for 2024, with missing values for J.B. Hunt. This absence of information could be indicative of ongoing strategic shifts or external market factors that have yet to be fully realized. As both companies navigate the evolving economic landscape, understanding the implications of these missing data points will be crucial for investors and analysts alike.
In conclusion, the analysis of SG&A expenses for United Rentals and J.B. Hunt Transport Services reveals significant insights into their operational strategies and financial health. As both companies continue to adapt to changing market conditions, monitoring these expenses will remain essential for stakeholders aiming to understand their long-term viability and growth potential. With the transportation and rental sectors poised for further evolution, the coming years will undoubtedly provide more data to analyze and interpret.
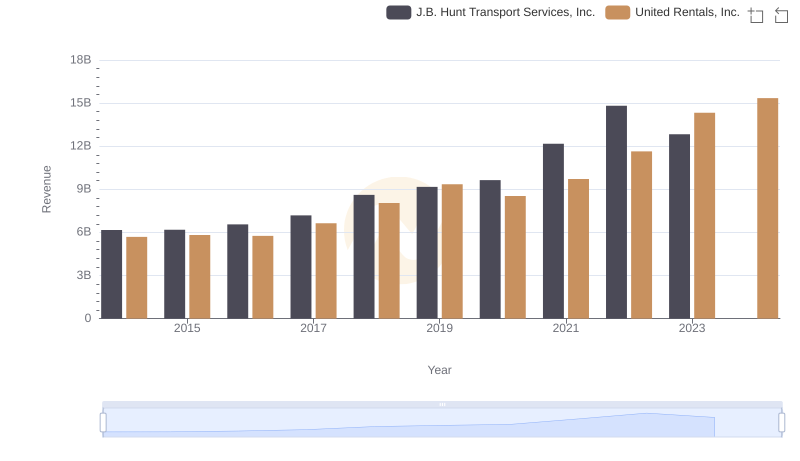
United Rentals, Inc. vs J.B. Hunt Transport Services, Inc.: Examining Key Revenue Metrics
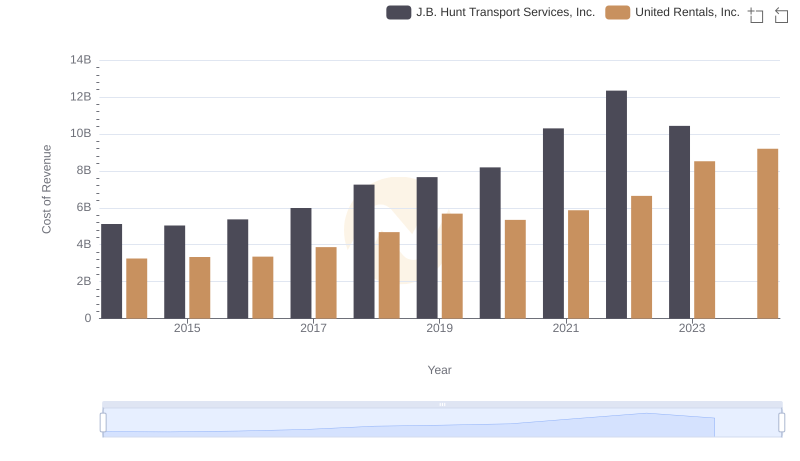
Cost of Revenue Comparison: United Rentals, Inc. vs J.B. Hunt Transport Services, Inc.
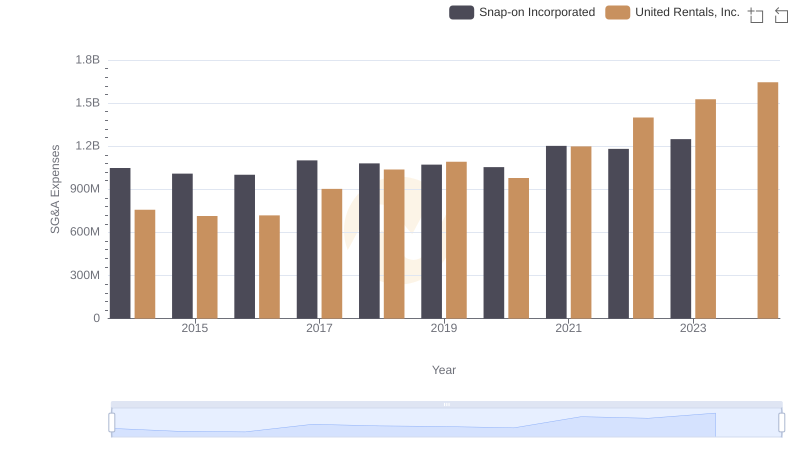
United Rentals, Inc. and Snap-on Incorporated: SG&A Spending Patterns Compared
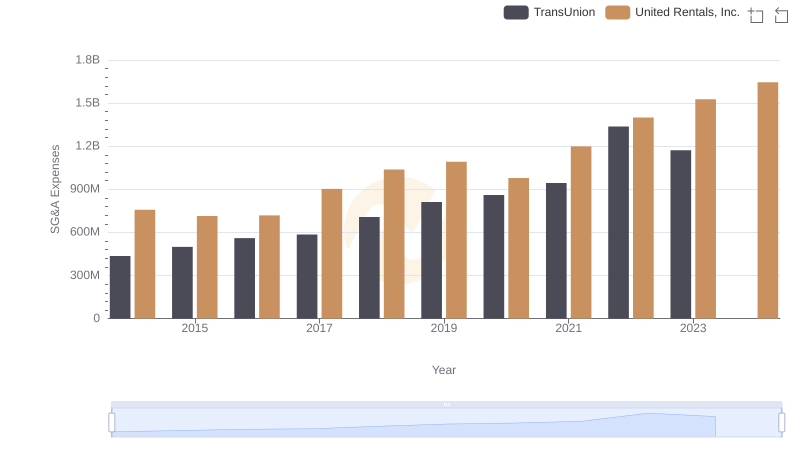
Breaking Down SG&A Expenses: United Rentals, Inc. vs TransUnion
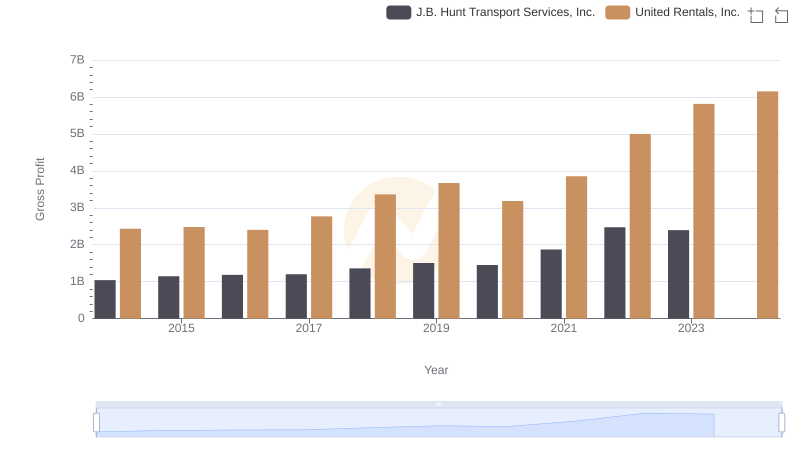
Gross Profit Comparison: United Rentals, Inc. and J.B. Hunt Transport Services, Inc. Trends
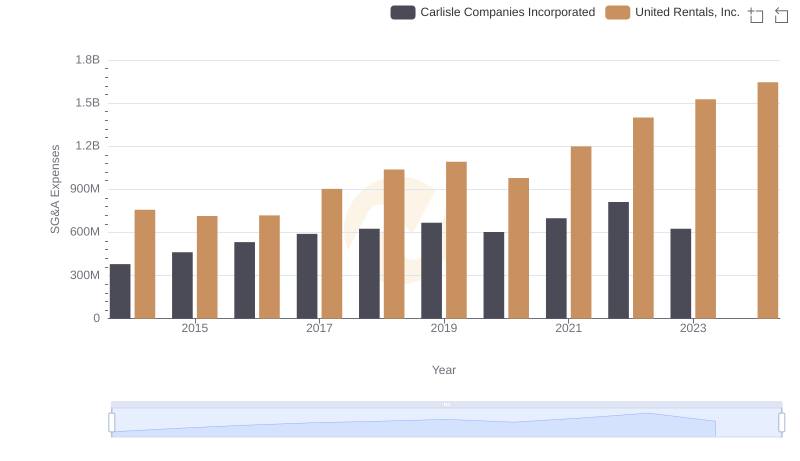
Who Optimizes SG&A Costs Better? United Rentals, Inc. or Carlisle Companies Incorporated
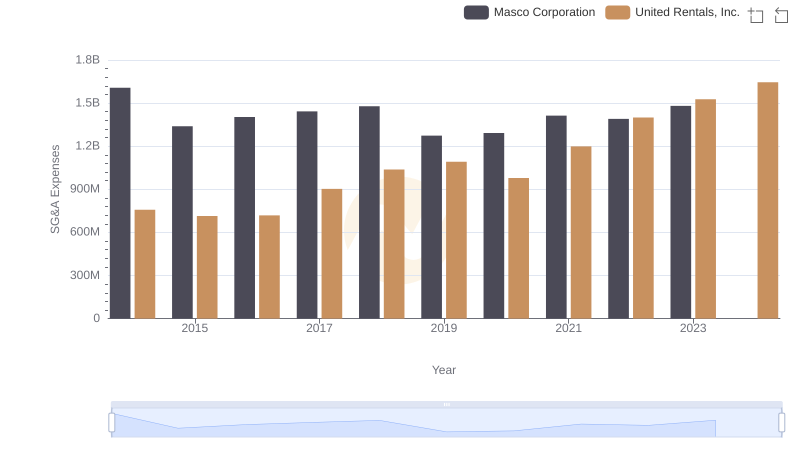
SG&A Efficiency Analysis: Comparing United Rentals, Inc. and Masco Corporation
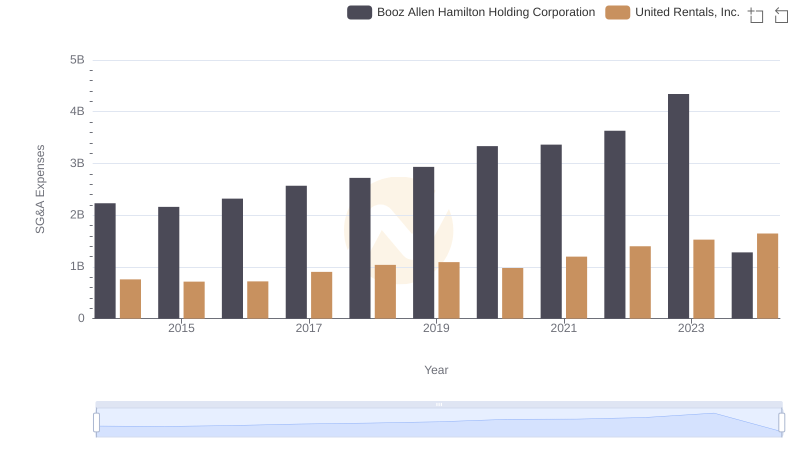
United Rentals, Inc. and Booz Allen Hamilton Holding Corporation: SG&A Spending Patterns Compared
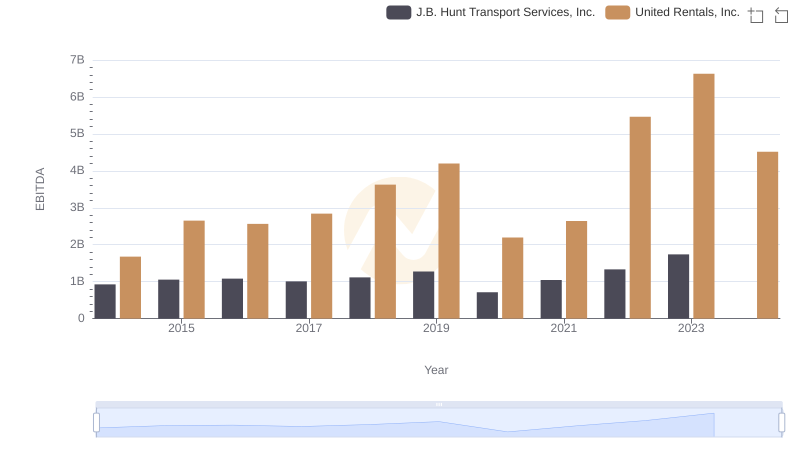
EBITDA Analysis: Evaluating United Rentals, Inc. Against J.B. Hunt Transport Services, Inc.
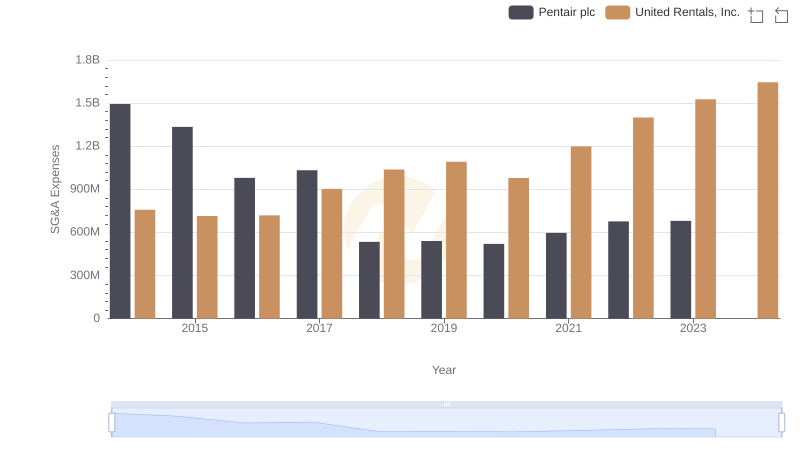
United Rentals, Inc. vs Pentair plc: SG&A Expense Trends
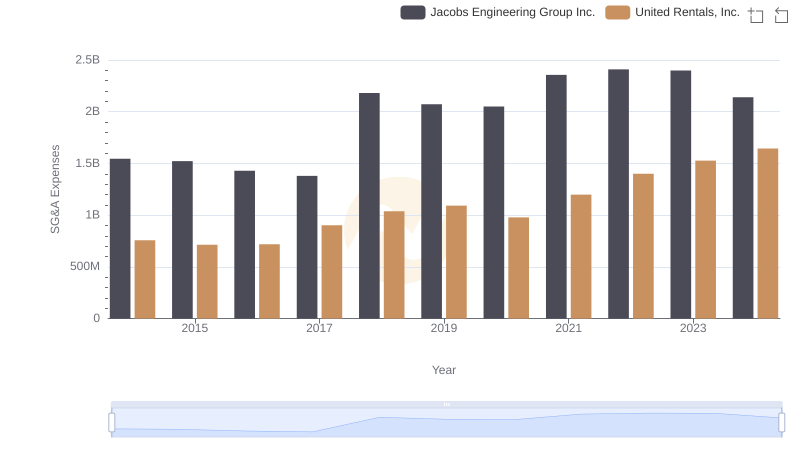
Who Optimizes SG&A Costs Better? United Rentals, Inc. or Jacobs Engineering Group Inc.
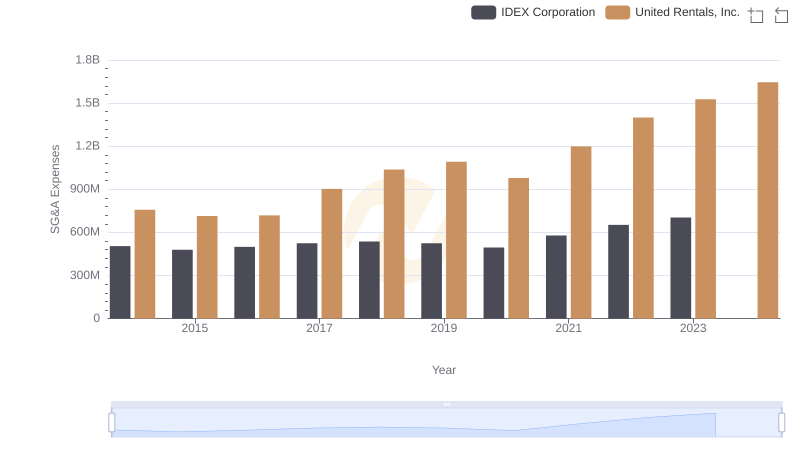
United Rentals, Inc. and IDEX Corporation: SG&A Spending Patterns Compared