| __timestamp | Equifax Inc. | Rockwell Automation, Inc. |
|---|---|---|
| Wednesday, January 1, 2014 | 751700000 | 1570100000 |
| Thursday, January 1, 2015 | 884300000 | 1506400000 |
| Friday, January 1, 2016 | 948200000 | 1467400000 |
| Sunday, January 1, 2017 | 1039100000 | 1591500000 |
| Monday, January 1, 2018 | 1213300000 | 1599000000 |
| Tuesday, January 1, 2019 | 1990200000 | 1538500000 |
| Wednesday, January 1, 2020 | 1322500000 | 1479800000 |
| Friday, January 1, 2021 | 1324600000 | 1680000000 |
| Saturday, January 1, 2022 | 1328900000 | 1766700000 |
| Sunday, January 1, 2023 | 1385700000 | 2023700000 |
| Monday, January 1, 2024 | 1450500000 | 2002600000 |
Unleashing insights
In the ever-evolving landscape of corporate finance, understanding the efficiency of Selling, General, and Administrative (SG&A) expenses is crucial. Over the past decade, Equifax Inc. and Rockwell Automation, Inc. have demonstrated contrasting trends in their SG&A expenditures. From 2014 to 2023, Equifax's SG&A expenses grew by approximately 84%, peaking in 2019. In contrast, Rockwell Automation maintained a more stable trajectory, with a notable 29% increase over the same period, culminating in 2023. This divergence highlights Equifax's aggressive expansion strategy, while Rockwell's steady approach underscores its operational consistency. Interestingly, 2024 data for Equifax is missing, leaving room for speculation on its future financial maneuvers. As these industry leaders navigate the complexities of the global market, their SG&A strategies offer valuable insights into their broader business philosophies.
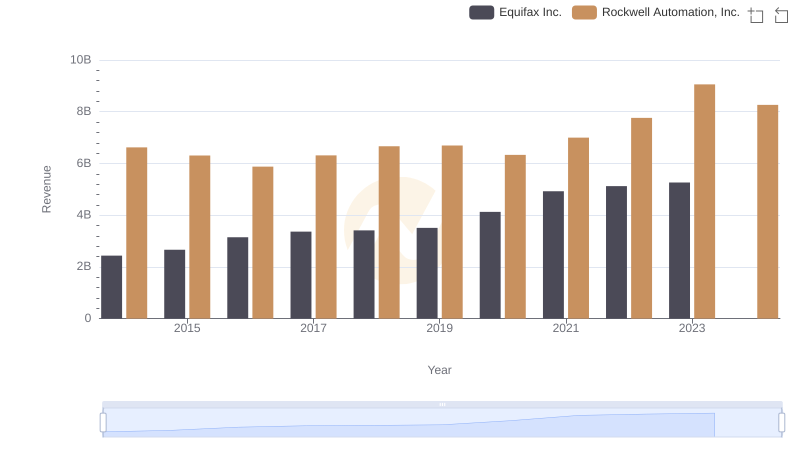
Who Generates More Revenue? Equifax Inc. or Rockwell Automation, Inc.
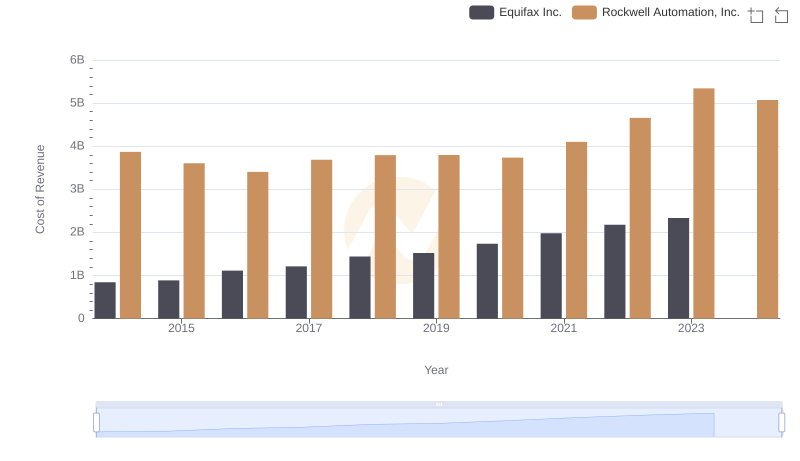
Cost of Revenue Comparison: Equifax Inc. vs Rockwell Automation, Inc.
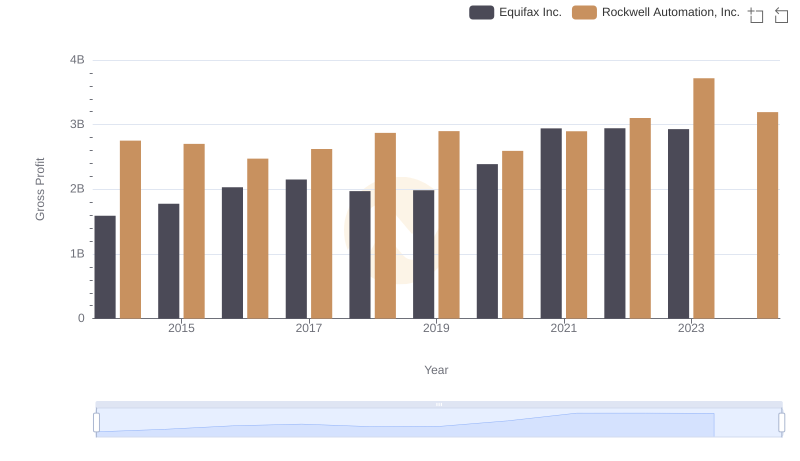
Gross Profit Analysis: Comparing Equifax Inc. and Rockwell Automation, Inc.
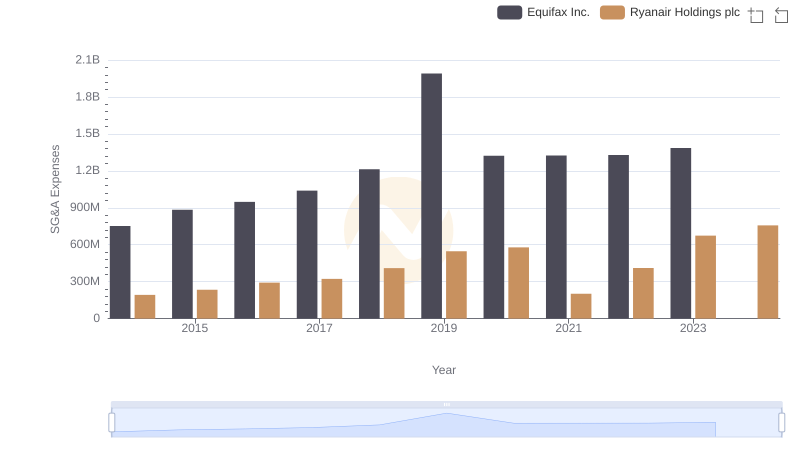
Operational Costs Compared: SG&A Analysis of Equifax Inc. and Ryanair Holdings plc
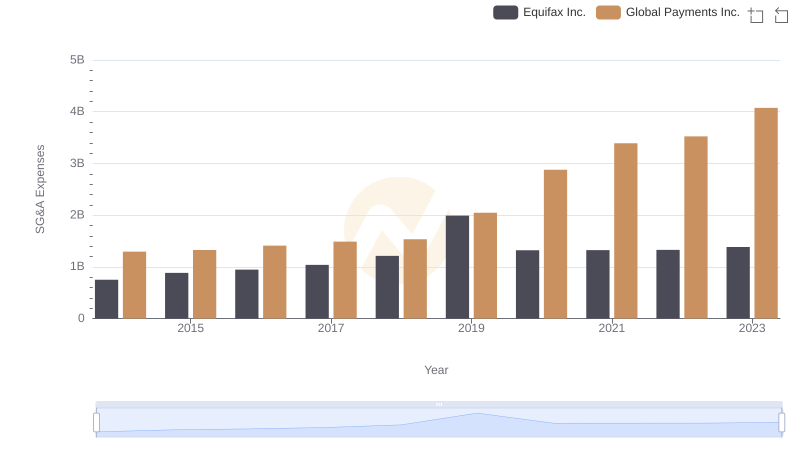
Breaking Down SG&A Expenses: Equifax Inc. vs Global Payments Inc.
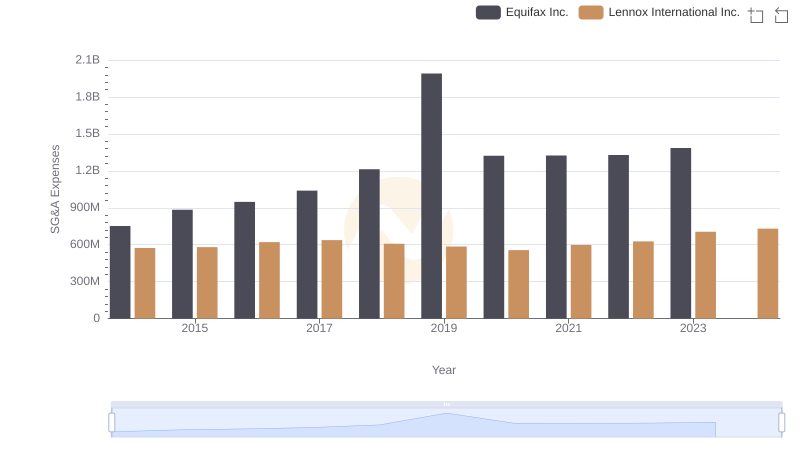
Selling, General, and Administrative Costs: Equifax Inc. vs Lennox International Inc.
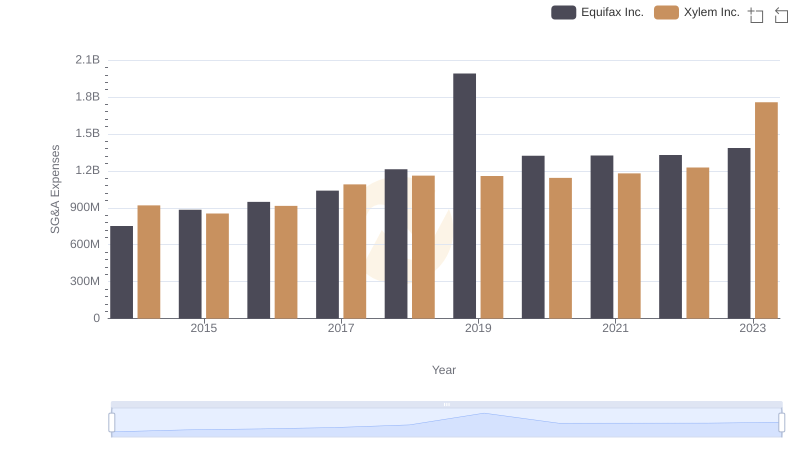
Equifax Inc. or Xylem Inc.: Who Manages SG&A Costs Better?
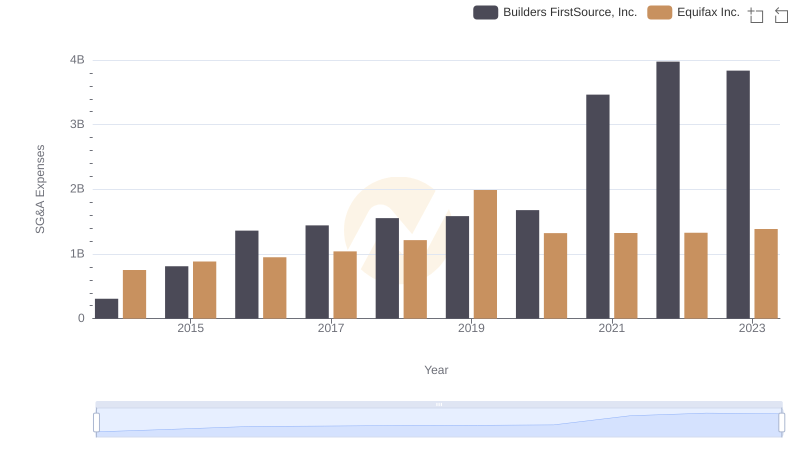
Selling, General, and Administrative Costs: Equifax Inc. vs Builders FirstSource, Inc.
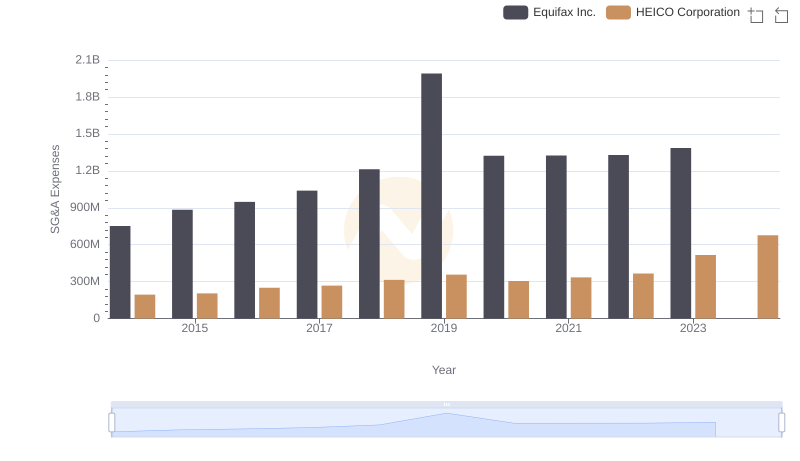
Comparing SG&A Expenses: Equifax Inc. vs HEICO Corporation Trends and Insights
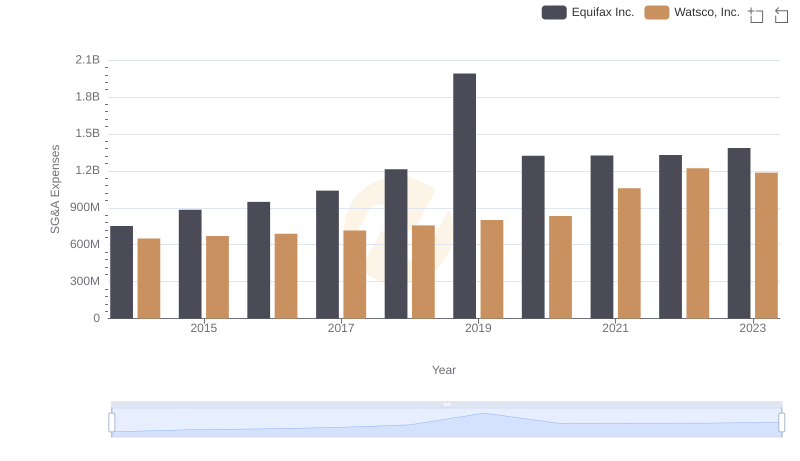
Cost Management Insights: SG&A Expenses for Equifax Inc. and Watsco, Inc.
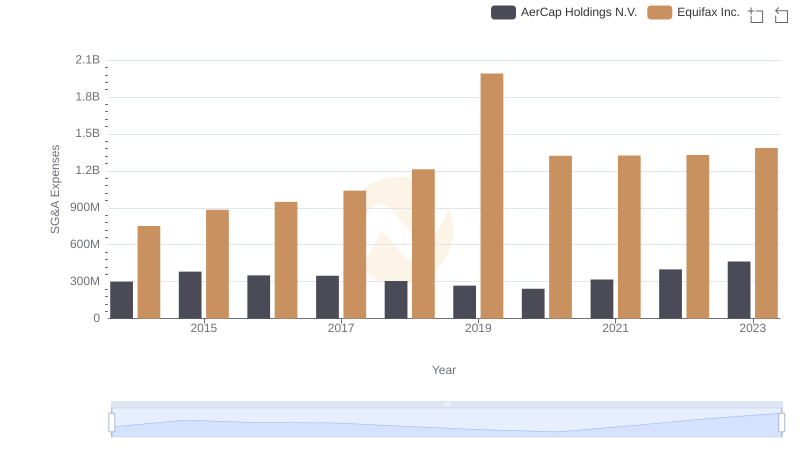
Comparing SG&A Expenses: Equifax Inc. vs AerCap Holdings N.V. Trends and Insights
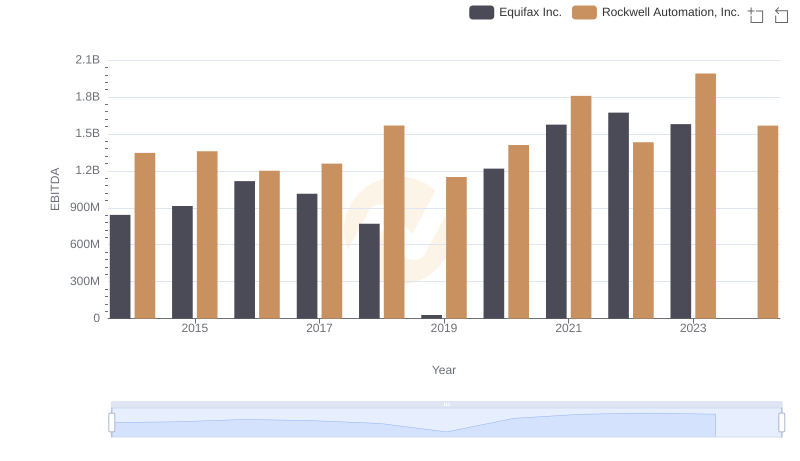
EBITDA Analysis: Evaluating Equifax Inc. Against Rockwell Automation, Inc.