| __timestamp | Equifax Inc. | Lennox International Inc. |
|---|---|---|
| Wednesday, January 1, 2014 | 751700000 | 573700000 |
| Thursday, January 1, 2015 | 884300000 | 580500000 |
| Friday, January 1, 2016 | 948200000 | 621000000 |
| Sunday, January 1, 2017 | 1039100000 | 637700000 |
| Monday, January 1, 2018 | 1213300000 | 608200000 |
| Tuesday, January 1, 2019 | 1990200000 | 585900000 |
| Wednesday, January 1, 2020 | 1322500000 | 555900000 |
| Friday, January 1, 2021 | 1324600000 | 598900000 |
| Saturday, January 1, 2022 | 1328900000 | 627200000 |
| Sunday, January 1, 2023 | 1385700000 | 705500000 |
| Monday, January 1, 2024 | 1450500000 | 730600000 |
Unleashing the power of data
In the competitive landscape of corporate America, managing Selling, General, and Administrative (SG&A) expenses is crucial for maintaining profitability. This chart provides a fascinating comparison between Equifax Inc. and Lennox International Inc. from 2014 to 2023. Over this period, Equifax's SG&A expenses have shown a significant upward trend, peaking in 2019 with a staggering 163% increase from 2014. Meanwhile, Lennox International has maintained a more stable trajectory, with a modest 23% rise over the same period.
The data reveals a notable divergence in 2019, where Equifax's expenses surged, possibly due to strategic investments or unforeseen costs. In contrast, Lennox's expenses remained relatively steady, reflecting a consistent operational strategy. Interestingly, the data for Equifax in 2024 is missing, leaving room for speculation on future trends. This analysis underscores the importance of strategic financial management in navigating the ever-evolving business environment.
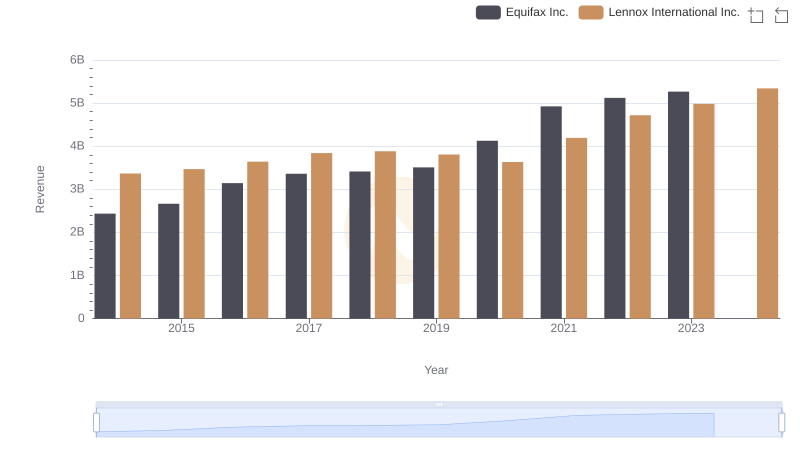
Annual Revenue Comparison: Equifax Inc. vs Lennox International Inc.
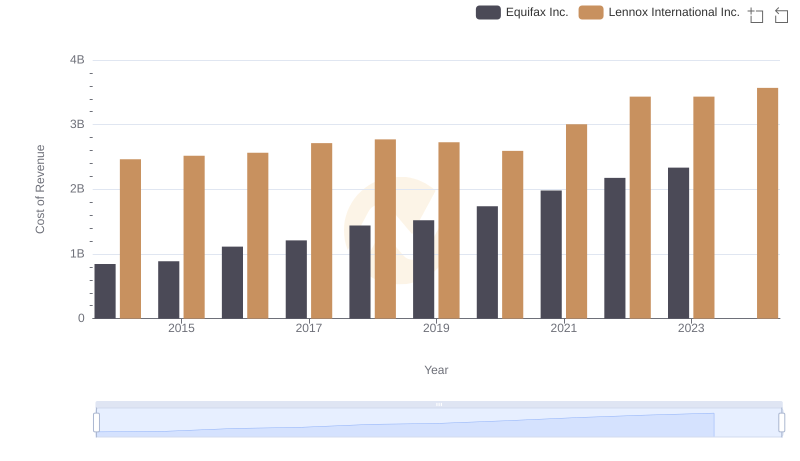
Cost of Revenue Comparison: Equifax Inc. vs Lennox International Inc.
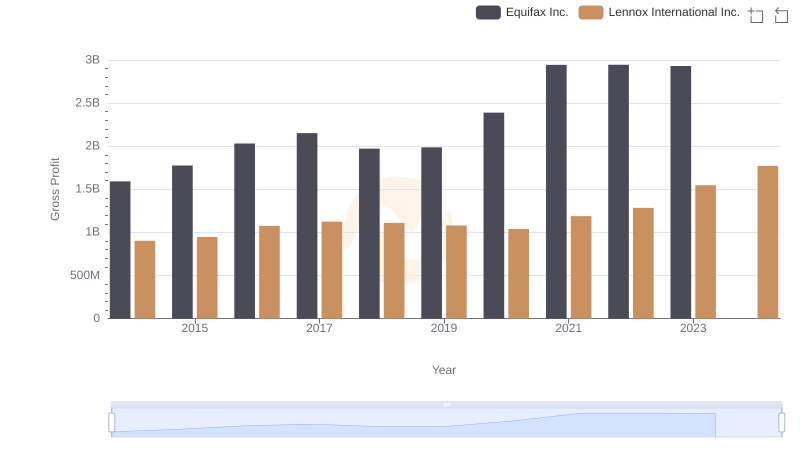
Equifax Inc. vs Lennox International Inc.: A Gross Profit Performance Breakdown
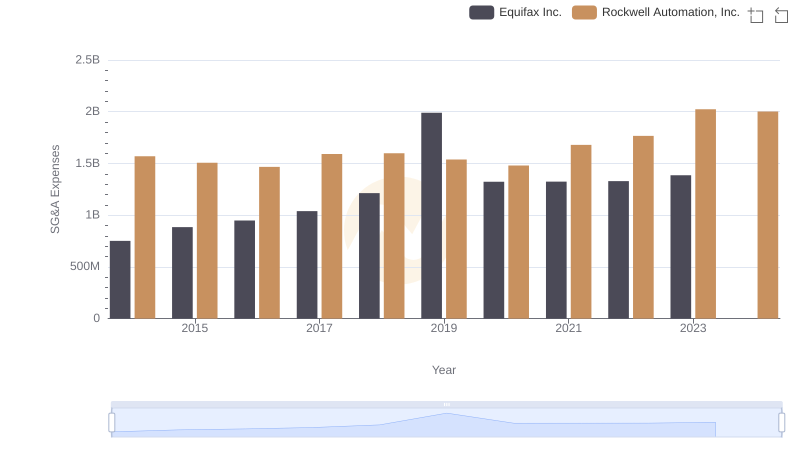
SG&A Efficiency Analysis: Comparing Equifax Inc. and Rockwell Automation, Inc.
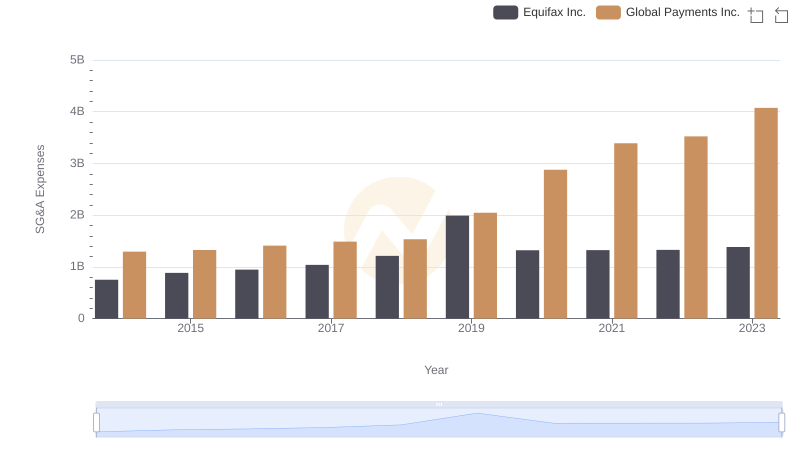
Breaking Down SG&A Expenses: Equifax Inc. vs Global Payments Inc.
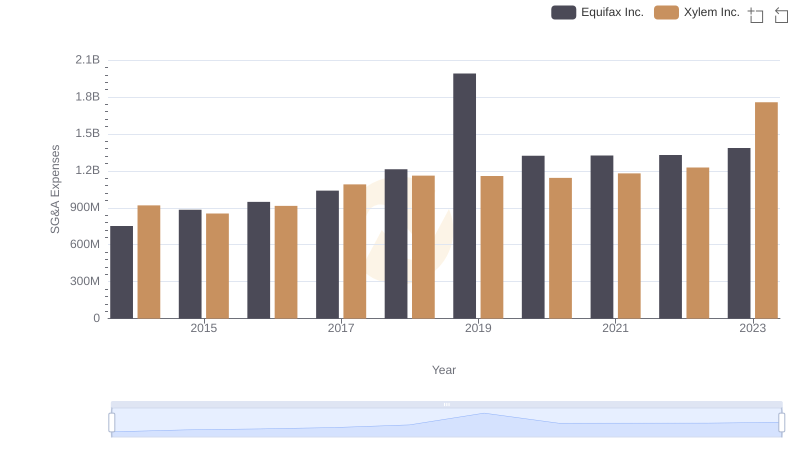
Equifax Inc. or Xylem Inc.: Who Manages SG&A Costs Better?
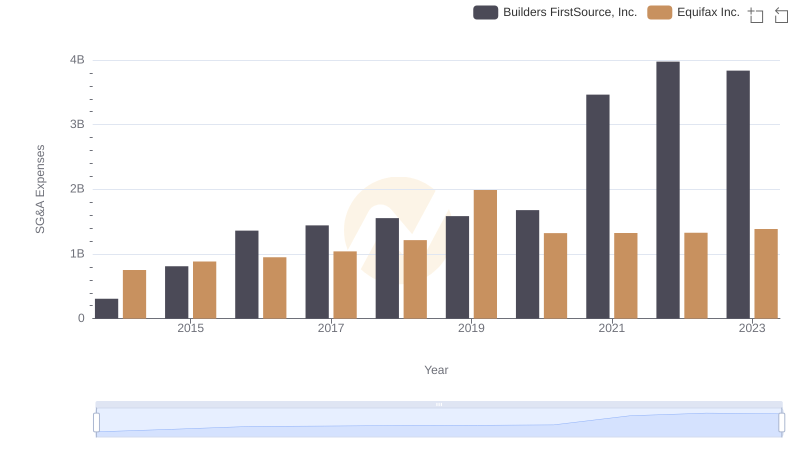
Selling, General, and Administrative Costs: Equifax Inc. vs Builders FirstSource, Inc.
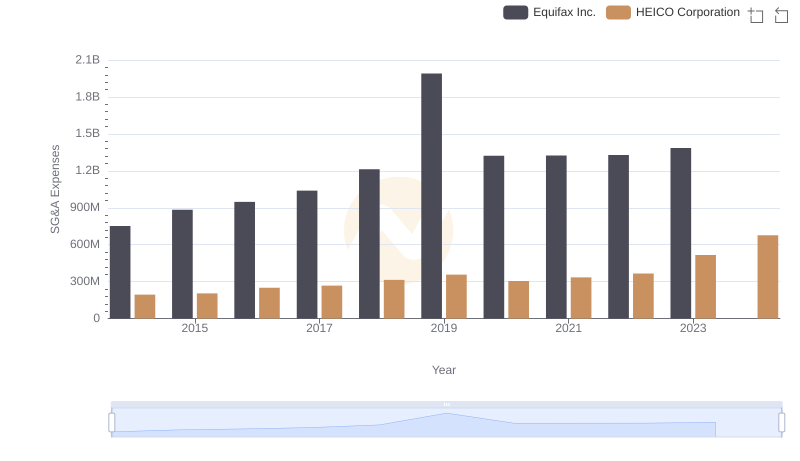
Comparing SG&A Expenses: Equifax Inc. vs HEICO Corporation Trends and Insights
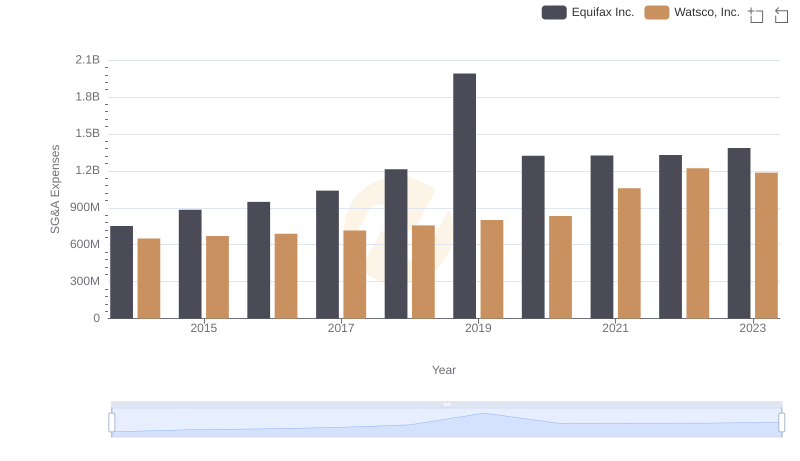
Cost Management Insights: SG&A Expenses for Equifax Inc. and Watsco, Inc.
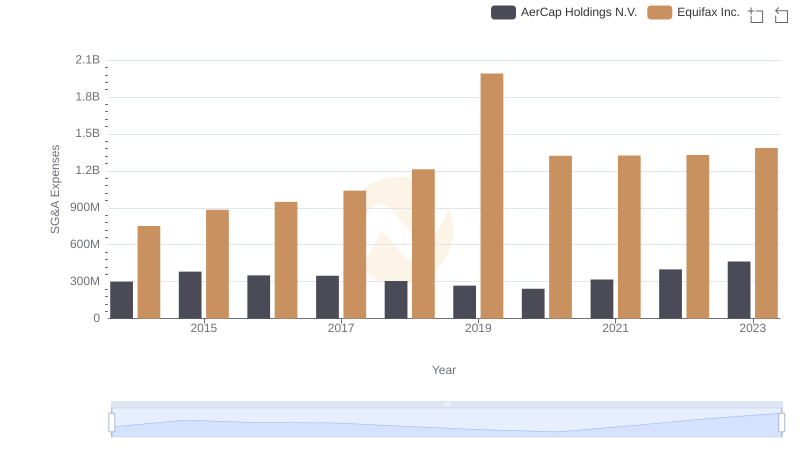
Comparing SG&A Expenses: Equifax Inc. vs AerCap Holdings N.V. Trends and Insights
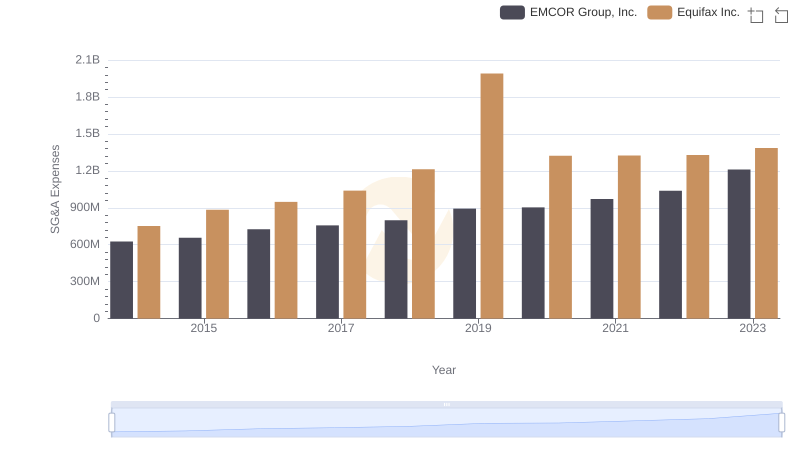
Breaking Down SG&A Expenses: Equifax Inc. vs EMCOR Group, Inc.