| __timestamp | AerCap Holdings N.V. | Equifax Inc. |
|---|---|---|
| Wednesday, January 1, 2014 | 299900000 | 751700000 |
| Thursday, January 1, 2015 | 381308000 | 884300000 |
| Friday, January 1, 2016 | 351012000 | 948200000 |
| Sunday, January 1, 2017 | 348291000 | 1039100000 |
| Monday, January 1, 2018 | 305226000 | 1213300000 |
| Tuesday, January 1, 2019 | 267458000 | 1990200000 |
| Wednesday, January 1, 2020 | 242161000 | 1322500000 |
| Friday, January 1, 2021 | 317888000 | 1324600000 |
| Saturday, January 1, 2022 | 399530000 | 1328900000 |
| Sunday, January 1, 2023 | 464128000 | 1385700000 |
| Monday, January 1, 2024 | 1450500000 |
Unleashing insights
In the world of corporate finance, Selling, General, and Administrative (SG&A) expenses are a crucial indicator of a company's operational efficiency. This analysis delves into the SG&A trends of Equifax Inc. and AerCap Holdings N.V. from 2014 to 2023.
Equifax Inc. has shown a consistent upward trajectory in its SG&A expenses, peaking in 2019 with a 165% increase from 2014. Despite a slight dip in 2020, the company rebounded, maintaining a steady growth rate, reaching approximately 1.39 billion in 2023.
Conversely, AerCap Holdings N.V. experienced fluctuations, with a notable 22% decrease in 2019. However, the company demonstrated resilience, achieving a 93% increase by 2023 compared to 2014.
These trends highlight the contrasting strategies and market conditions faced by these companies. Equifax's steady increase suggests a focus on expansion and investment, while AerCap's volatility may reflect industry-specific challenges and strategic adjustments.
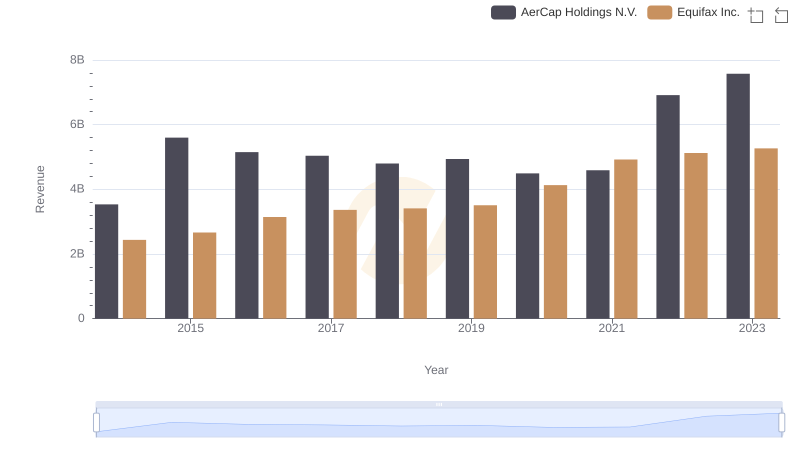
Revenue Showdown: Equifax Inc. vs AerCap Holdings N.V.
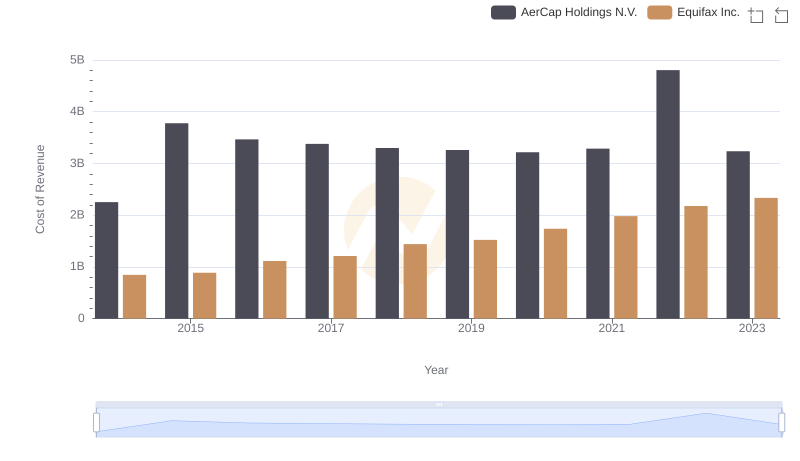
Analyzing Cost of Revenue: Equifax Inc. and AerCap Holdings N.V.
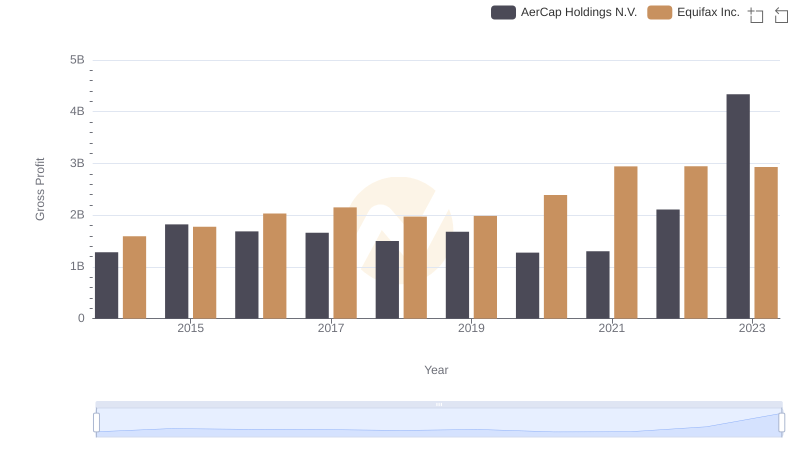
Key Insights on Gross Profit: Equifax Inc. vs AerCap Holdings N.V.
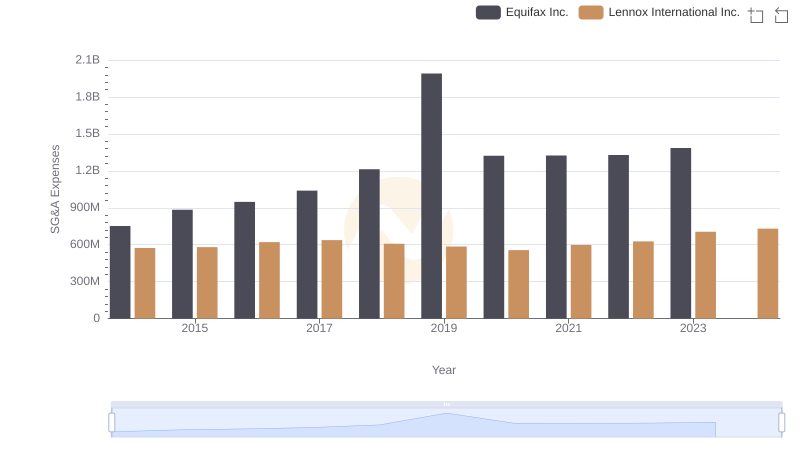
Selling, General, and Administrative Costs: Equifax Inc. vs Lennox International Inc.
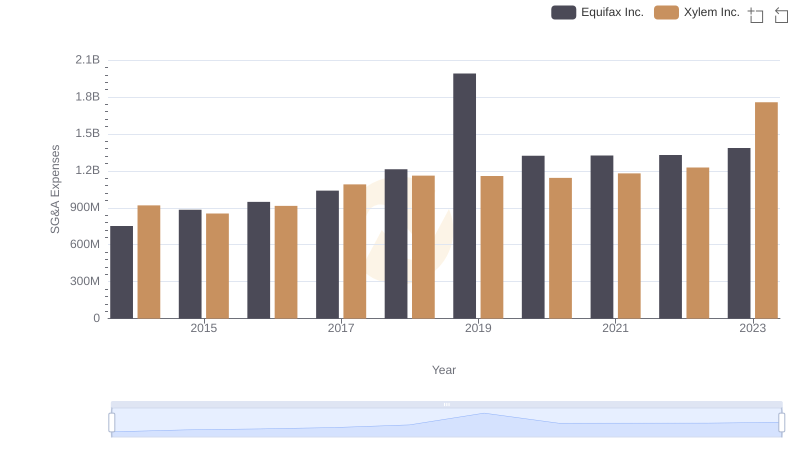
Equifax Inc. or Xylem Inc.: Who Manages SG&A Costs Better?
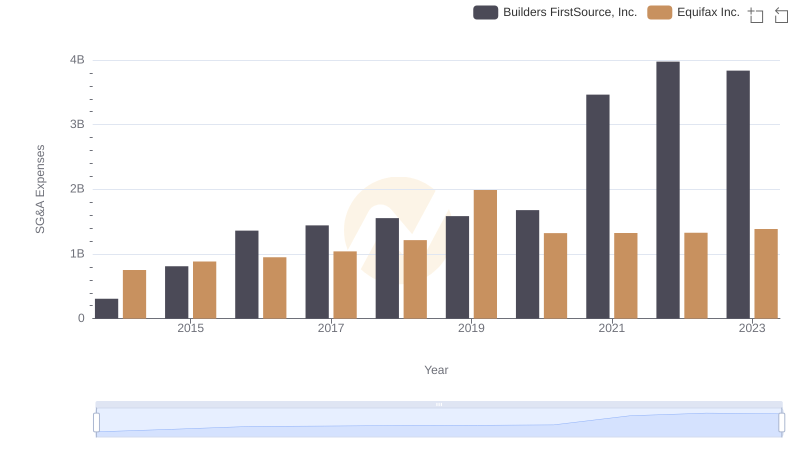
Selling, General, and Administrative Costs: Equifax Inc. vs Builders FirstSource, Inc.
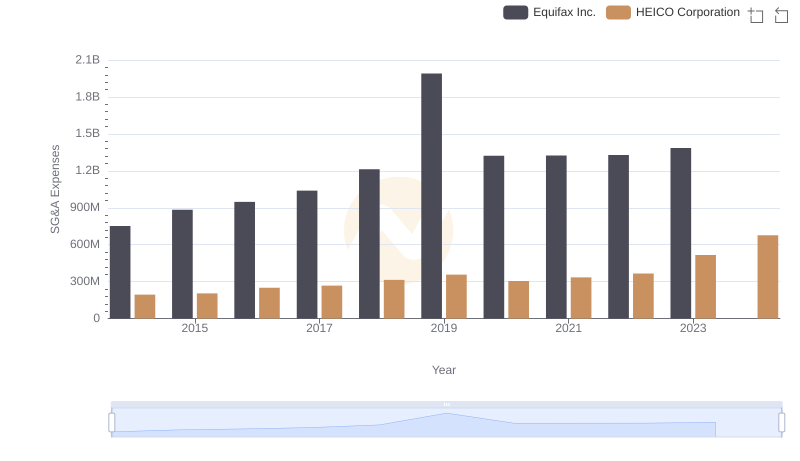
Comparing SG&A Expenses: Equifax Inc. vs HEICO Corporation Trends and Insights
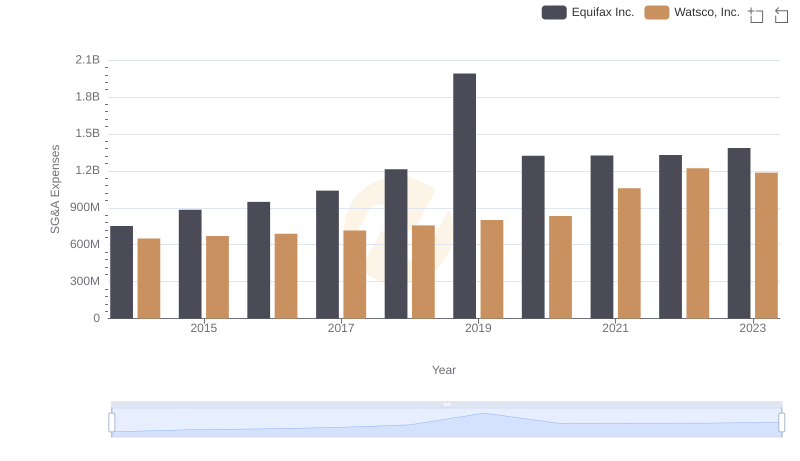
Cost Management Insights: SG&A Expenses for Equifax Inc. and Watsco, Inc.
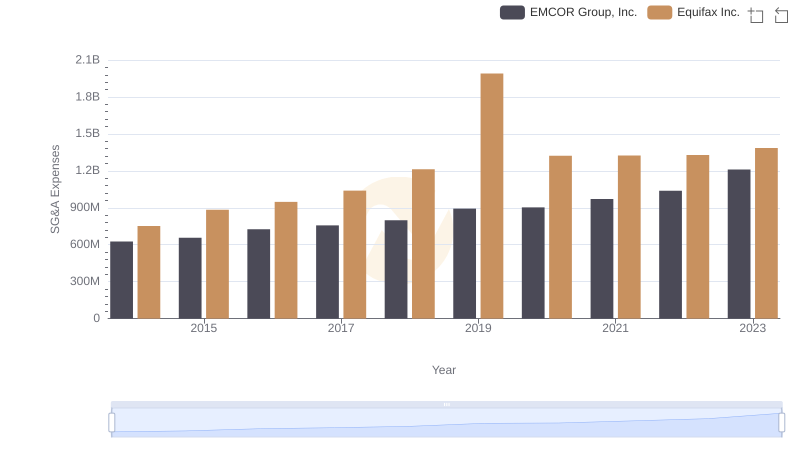
Breaking Down SG&A Expenses: Equifax Inc. vs EMCOR Group, Inc.
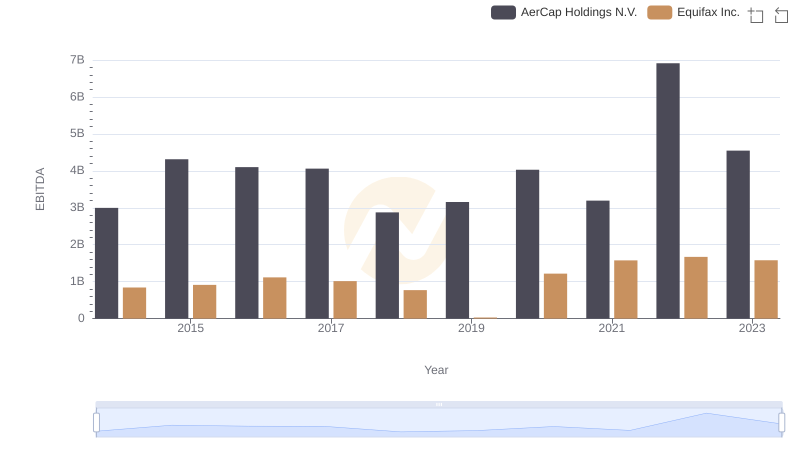
A Side-by-Side Analysis of EBITDA: Equifax Inc. and AerCap Holdings N.V.