| __timestamp | Equifax Inc. | Rockwell Automation, Inc. |
|---|---|---|
| Wednesday, January 1, 2014 | 842400000 | 1346000000 |
| Thursday, January 1, 2015 | 914600000 | 1359100000 |
| Friday, January 1, 2016 | 1116900000 | 1200700000 |
| Sunday, January 1, 2017 | 1013900000 | 1258400000 |
| Monday, January 1, 2018 | 770200000 | 1568400000 |
| Tuesday, January 1, 2019 | 29000000 | 1150200000 |
| Wednesday, January 1, 2020 | 1217800000 | 1410200000 |
| Friday, January 1, 2021 | 1575200000 | 1808300000 |
| Saturday, January 1, 2022 | 1672800000 | 1432100000 |
| Sunday, January 1, 2023 | 1579100000 | 1990700000 |
| Monday, January 1, 2024 | 1251200000 | 1567500000 |
Unveiling the hidden dimensions of data
In the ever-evolving landscape of financial performance, EBITDA serves as a crucial metric for evaluating a company's operational efficiency. This analysis delves into the EBITDA trends of Equifax Inc. and Rockwell Automation, Inc. from 2014 to 2023. Over this period, Rockwell Automation consistently outperformed Equifax, with an average EBITDA approximately 36% higher. Notably, Equifax experienced a significant dip in 2019, with EBITDA plummeting to a mere fraction of its usual performance, while Rockwell Automation maintained a steady trajectory. By 2023, Rockwell Automation's EBITDA peaked at nearly 2 billion, marking a 48% increase from 2014. In contrast, Equifax's EBITDA showed a recovery post-2019, reaching its highest in 2022. This comparative analysis highlights the resilience and growth strategies of these industry giants, offering valuable insights for investors and stakeholders.
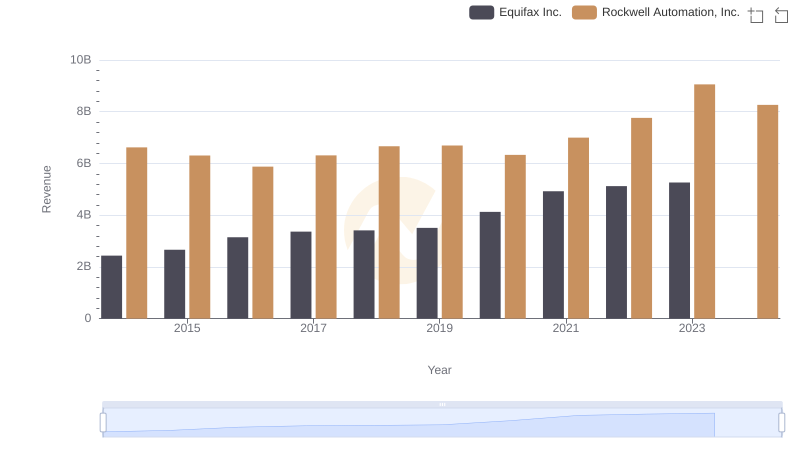
Who Generates More Revenue? Equifax Inc. or Rockwell Automation, Inc.
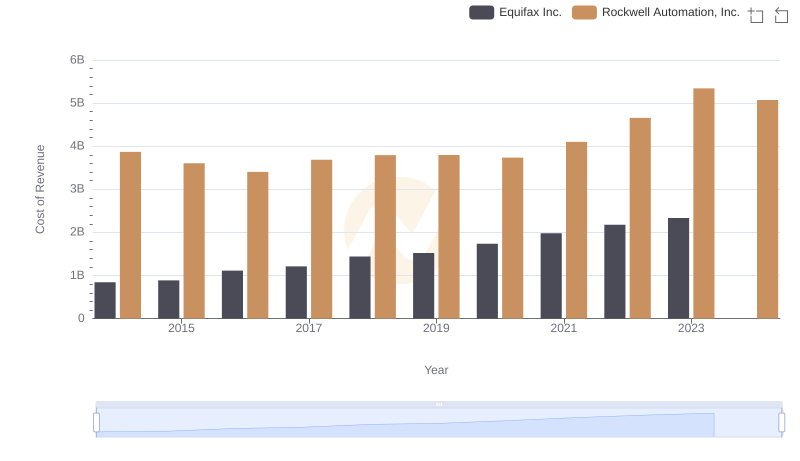
Cost of Revenue Comparison: Equifax Inc. vs Rockwell Automation, Inc.
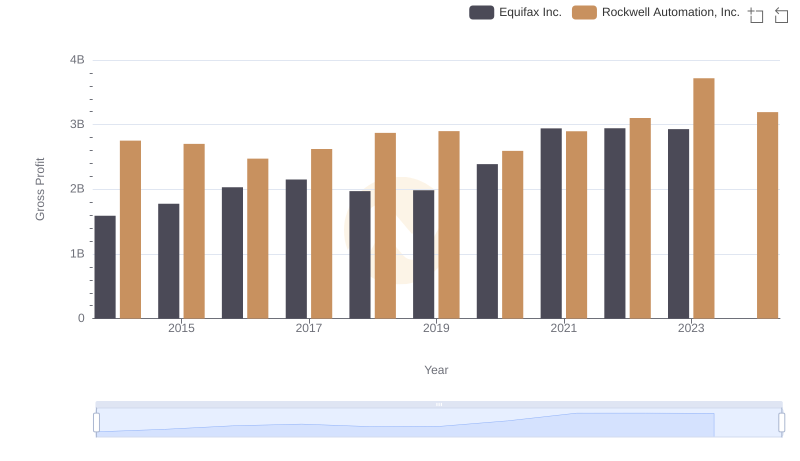
Gross Profit Analysis: Comparing Equifax Inc. and Rockwell Automation, Inc.
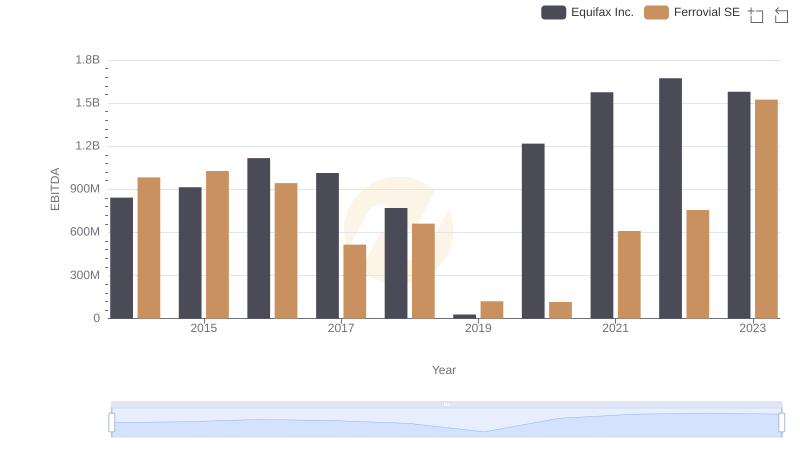
Comprehensive EBITDA Comparison: Equifax Inc. vs Ferrovial SE
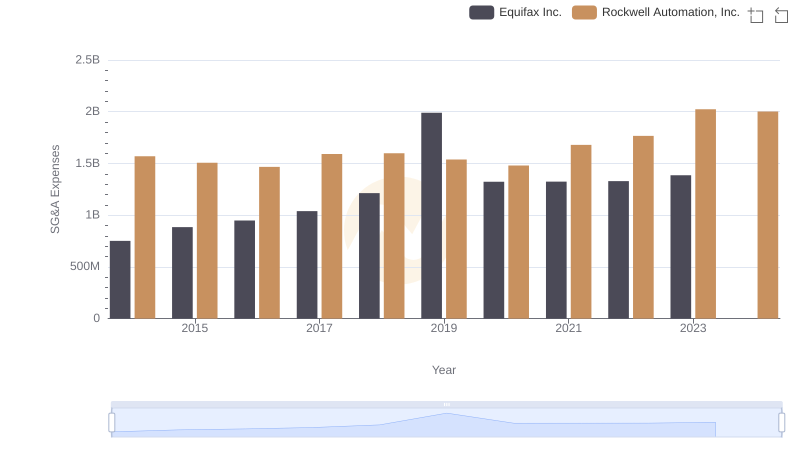
SG&A Efficiency Analysis: Comparing Equifax Inc. and Rockwell Automation, Inc.
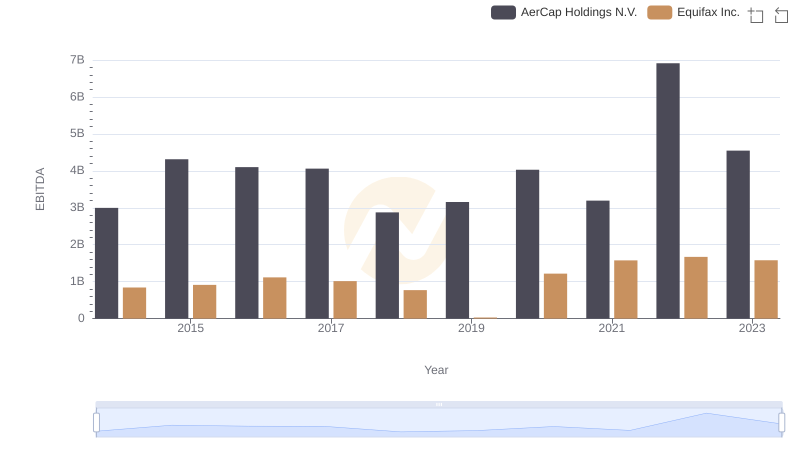
A Side-by-Side Analysis of EBITDA: Equifax Inc. and AerCap Holdings N.V.
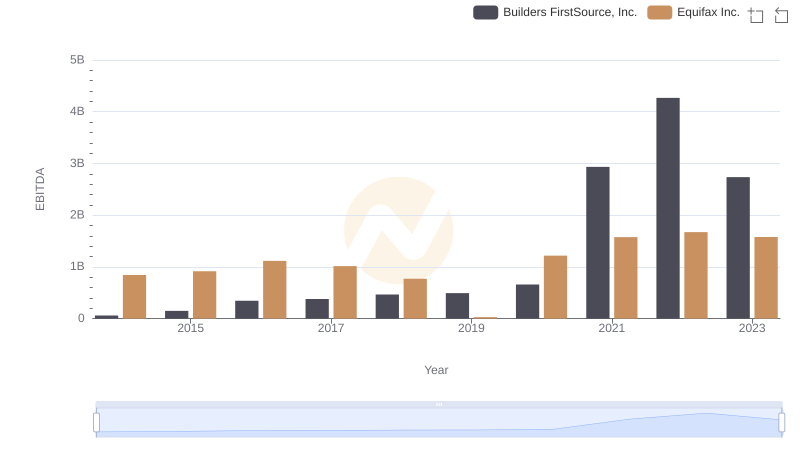
Comparative EBITDA Analysis: Equifax Inc. vs Builders FirstSource, Inc.