| __timestamp | Equifax Inc. | Global Payments Inc. |
|---|---|---|
| Wednesday, January 1, 2014 | 751700000 | 1295014000 |
| Thursday, January 1, 2015 | 884300000 | 1325567000 |
| Friday, January 1, 2016 | 948200000 | 1411096000 |
| Sunday, January 1, 2017 | 1039100000 | 1488258000 |
| Monday, January 1, 2018 | 1213300000 | 1534297000 |
| Tuesday, January 1, 2019 | 1990200000 | 2046672000 |
| Wednesday, January 1, 2020 | 1322500000 | 2878878000 |
| Friday, January 1, 2021 | 1324600000 | 3391161000 |
| Saturday, January 1, 2022 | 1328900000 | 3524578000 |
| Sunday, January 1, 2023 | 1385700000 | 4073768000 |
| Monday, January 1, 2024 | 1450500000 | 4285307000 |
Unlocking the unknown
In the ever-evolving financial landscape, understanding the nuances of Selling, General, and Administrative (SG&A) expenses is crucial for investors and analysts alike. Over the past decade, Equifax Inc. and Global Payments Inc. have demonstrated distinct trajectories in their SG&A expenditures. From 2014 to 2023, Global Payments Inc. has seen a staggering 214% increase in SG&A expenses, peaking at approximately $4.07 billion in 2023. In contrast, Equifax Inc. experienced a more modest growth of 84%, reaching around $1.39 billion in the same year. This divergence highlights Global Payments Inc.'s aggressive expansion and operational scaling, while Equifax Inc. maintains a steadier growth path. Such insights are invaluable for stakeholders aiming to gauge the financial health and strategic direction of these industry giants.
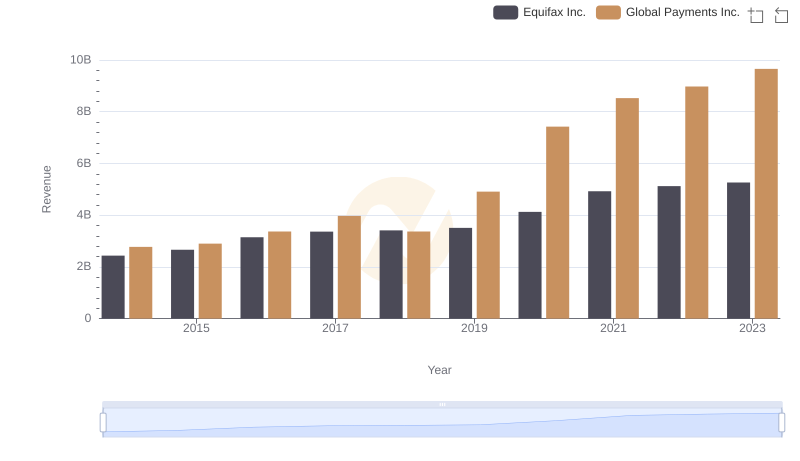
Comparing Revenue Performance: Equifax Inc. or Global Payments Inc.?
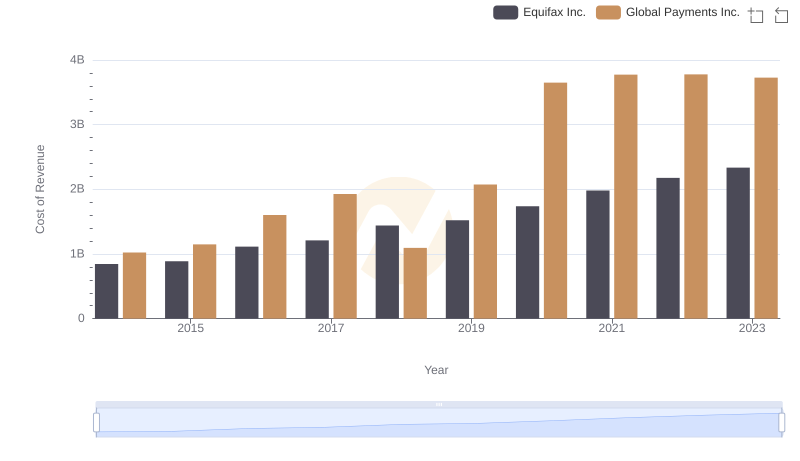
Comparing Cost of Revenue Efficiency: Equifax Inc. vs Global Payments Inc.
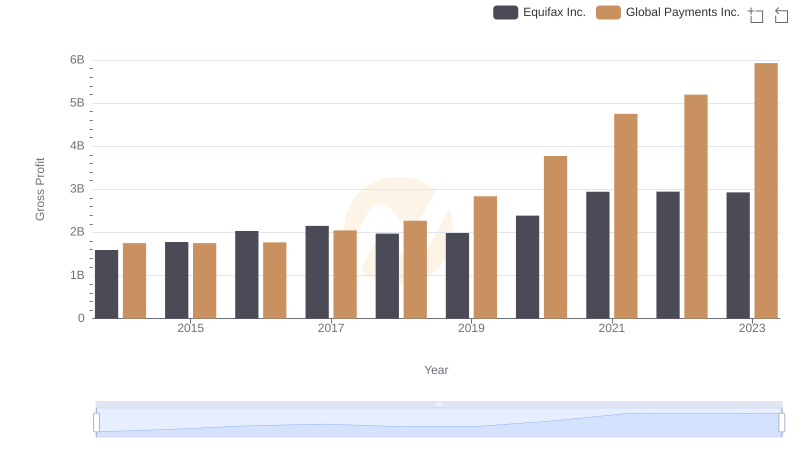
Who Generates Higher Gross Profit? Equifax Inc. or Global Payments Inc.
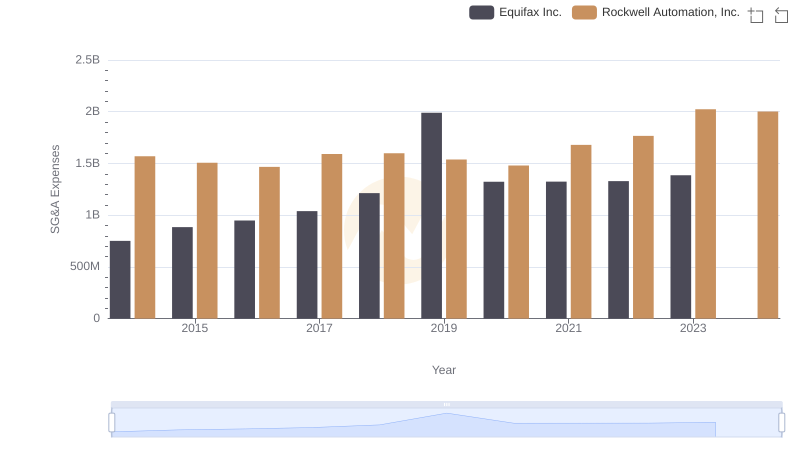
SG&A Efficiency Analysis: Comparing Equifax Inc. and Rockwell Automation, Inc.
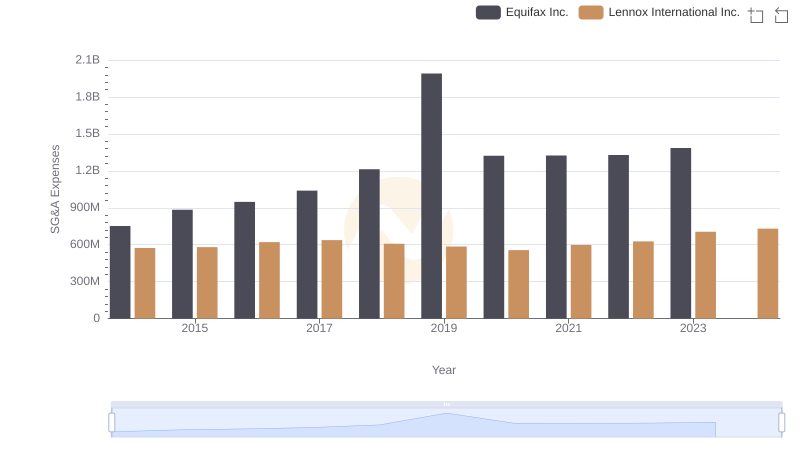
Selling, General, and Administrative Costs: Equifax Inc. vs Lennox International Inc.
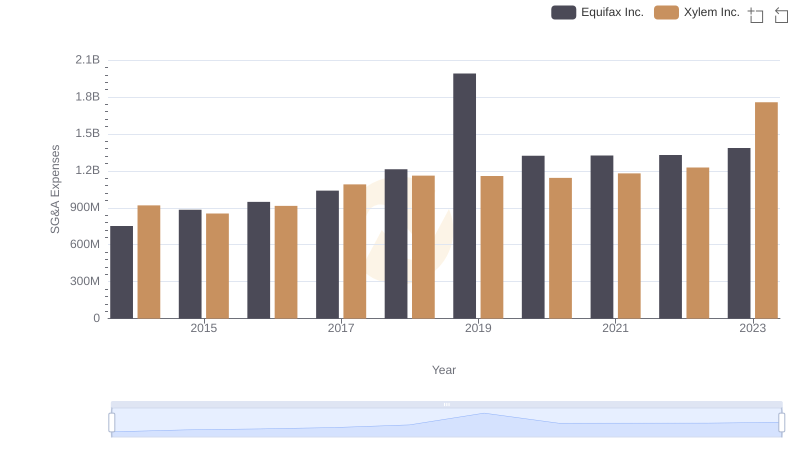
Equifax Inc. or Xylem Inc.: Who Manages SG&A Costs Better?
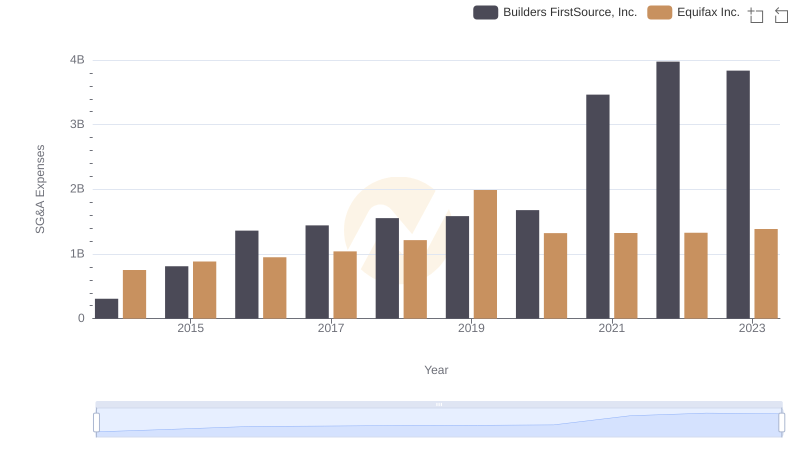
Selling, General, and Administrative Costs: Equifax Inc. vs Builders FirstSource, Inc.
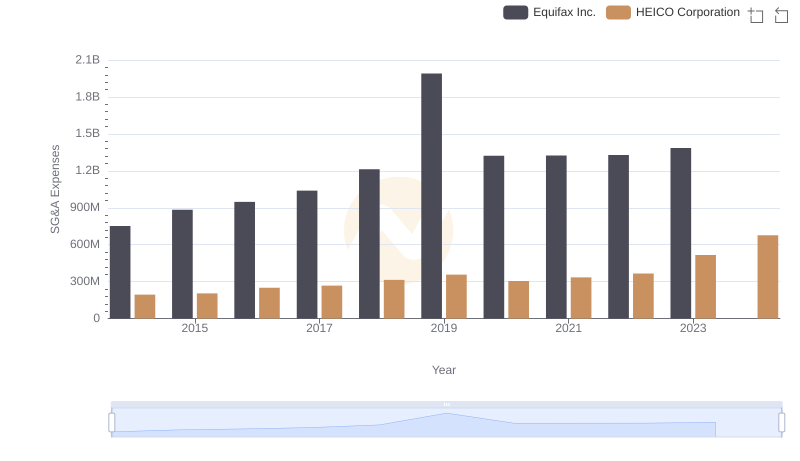
Comparing SG&A Expenses: Equifax Inc. vs HEICO Corporation Trends and Insights
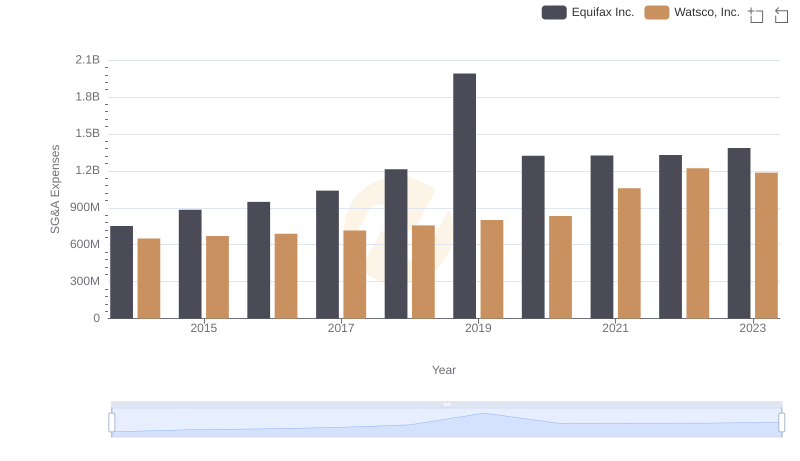
Cost Management Insights: SG&A Expenses for Equifax Inc. and Watsco, Inc.
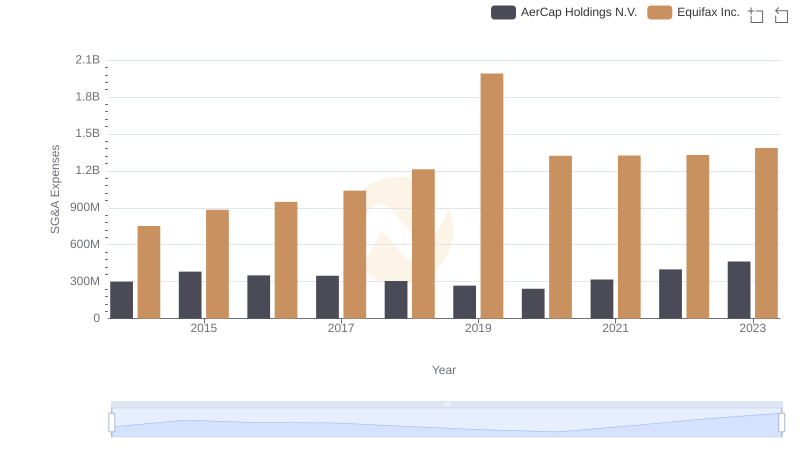
Comparing SG&A Expenses: Equifax Inc. vs AerCap Holdings N.V. Trends and Insights
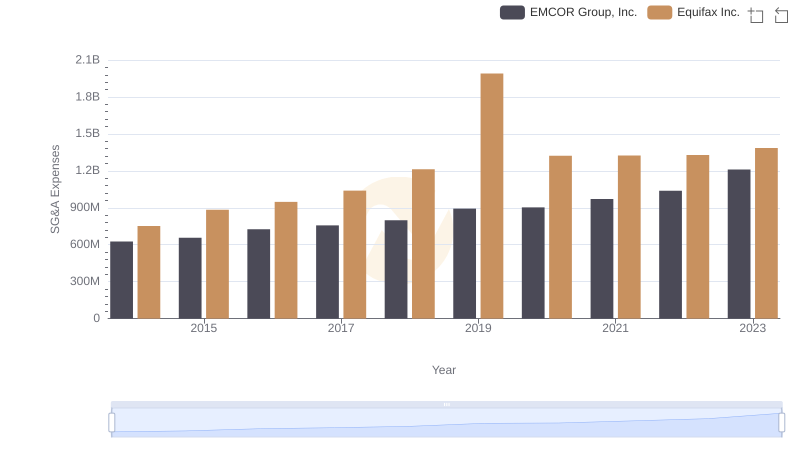
Breaking Down SG&A Expenses: Equifax Inc. vs EMCOR Group, Inc.