| __timestamp | AerCap Holdings N.V. | United Rentals, Inc. |
|---|---|---|
| Wednesday, January 1, 2014 | 299900000 | 758000000 |
| Thursday, January 1, 2015 | 381308000 | 714000000 |
| Friday, January 1, 2016 | 351012000 | 719000000 |
| Sunday, January 1, 2017 | 348291000 | 903000000 |
| Monday, January 1, 2018 | 305226000 | 1038000000 |
| Tuesday, January 1, 2019 | 267458000 | 1092000000 |
| Wednesday, January 1, 2020 | 242161000 | 979000000 |
| Friday, January 1, 2021 | 317888000 | 1199000000 |
| Saturday, January 1, 2022 | 399530000 | 1400000000 |
| Sunday, January 1, 2023 | 464128000 | 1527000000 |
| Monday, January 1, 2024 | 1645000000 |
Unleashing the power of data
In the dynamic world of corporate finance, understanding cost management is crucial. This analysis delves into the Selling, General, and Administrative (SG&A) expenses of two industry titans: United Rentals, Inc. and AerCap Holdings N.V., from 2014 to 2023.
United Rentals, Inc. has shown a consistent upward trend in SG&A expenses, peaking at approximately 1.53 billion USD in 2023, a remarkable 102% increase from 2014. This growth reflects the company's strategic investments and expansion efforts. In contrast, AerCap Holdings N.V. experienced a more volatile trajectory, with expenses fluctuating but ultimately rising by about 55% over the same period, reaching 464 million USD in 2023.
The data for 2024 is incomplete, highlighting the importance of continuous monitoring. These insights underscore the diverse strategies employed by these companies in managing operational costs, offering valuable lessons for businesses aiming to optimize their financial performance.
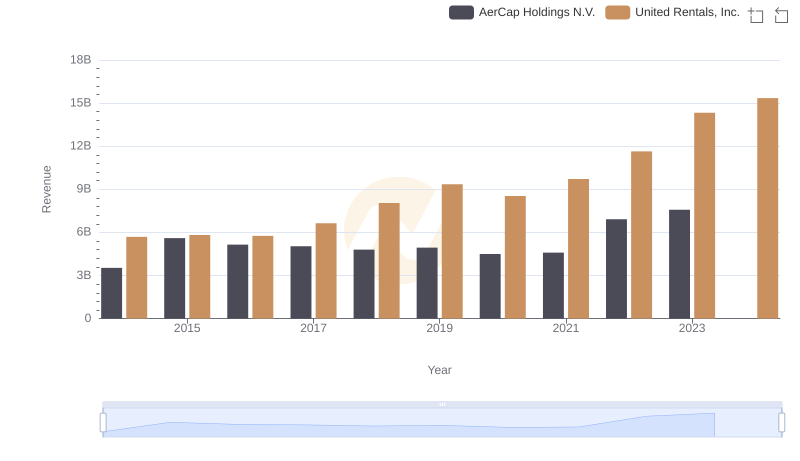
United Rentals, Inc. vs AerCap Holdings N.V.: Annual Revenue Growth Compared
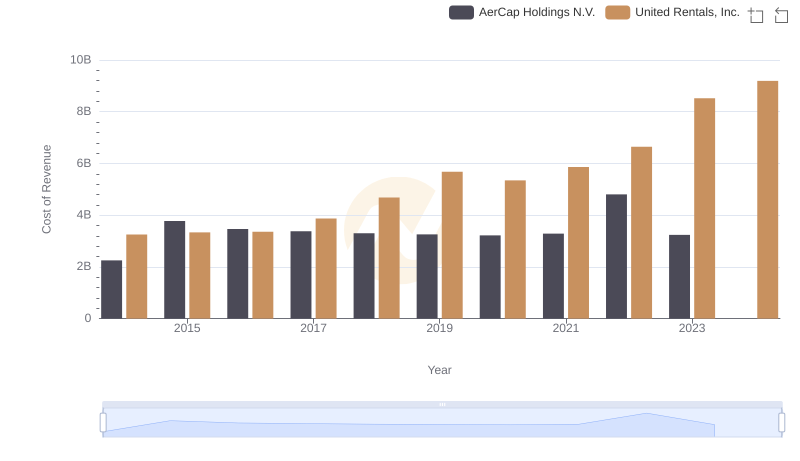
Cost Insights: Breaking Down United Rentals, Inc. and AerCap Holdings N.V.'s Expenses
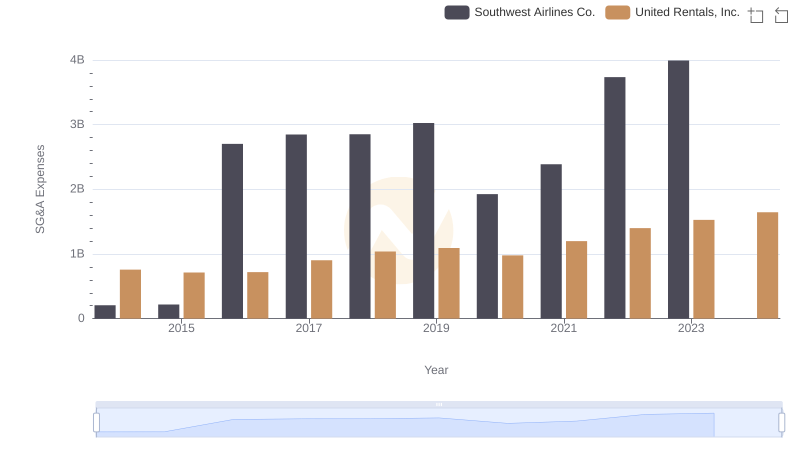
Cost Management Insights: SG&A Expenses for United Rentals, Inc. and Southwest Airlines Co.
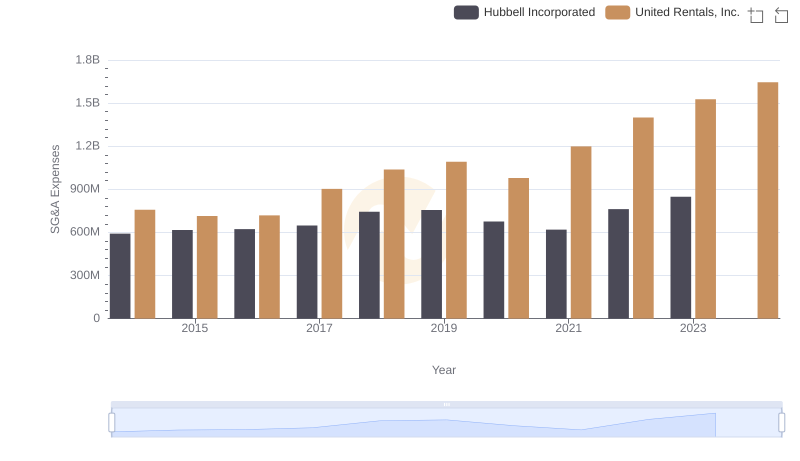
Who Optimizes SG&A Costs Better? United Rentals, Inc. or Hubbell Incorporated
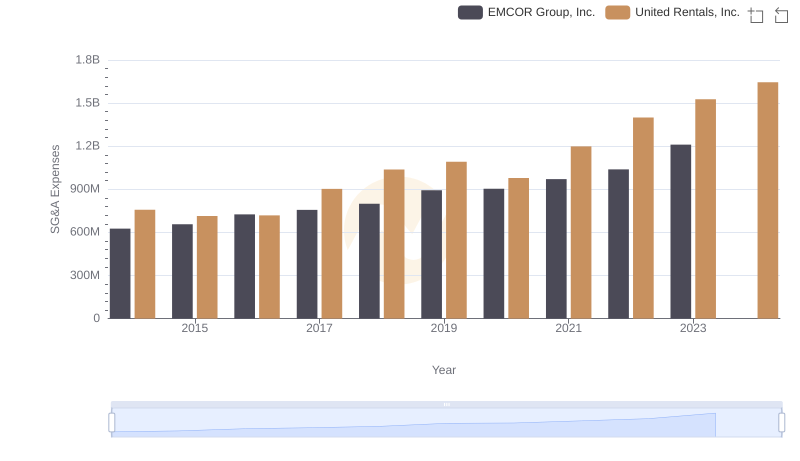
SG&A Efficiency Analysis: Comparing United Rentals, Inc. and EMCOR Group, Inc.
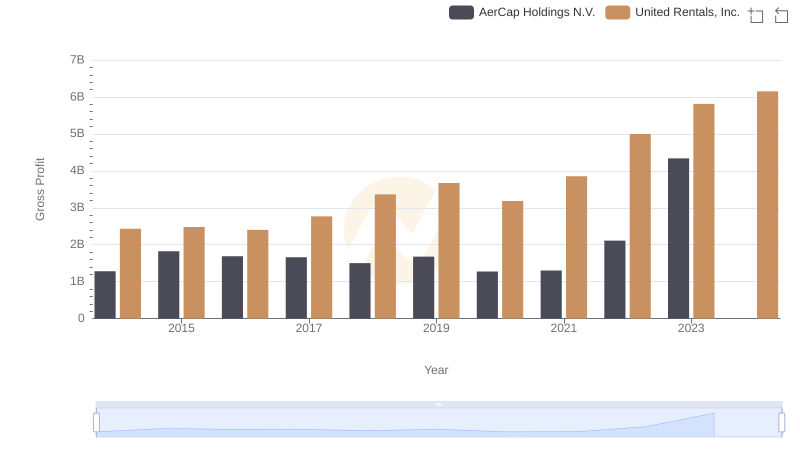
Gross Profit Analysis: Comparing United Rentals, Inc. and AerCap Holdings N.V.
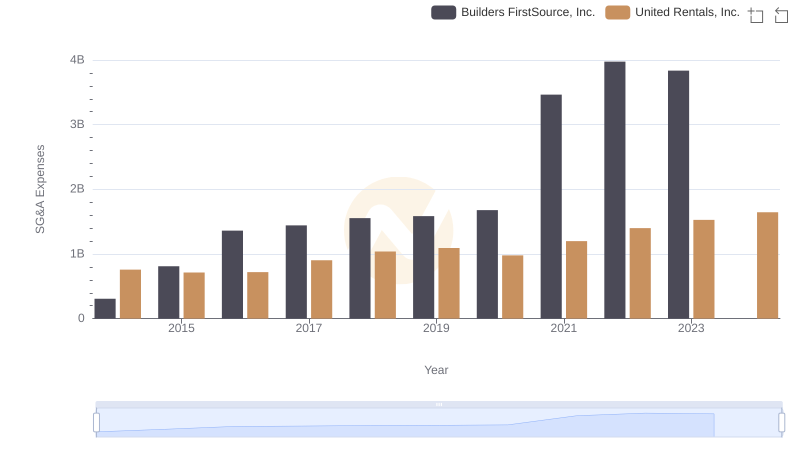
Who Optimizes SG&A Costs Better? United Rentals, Inc. or Builders FirstSource, Inc.
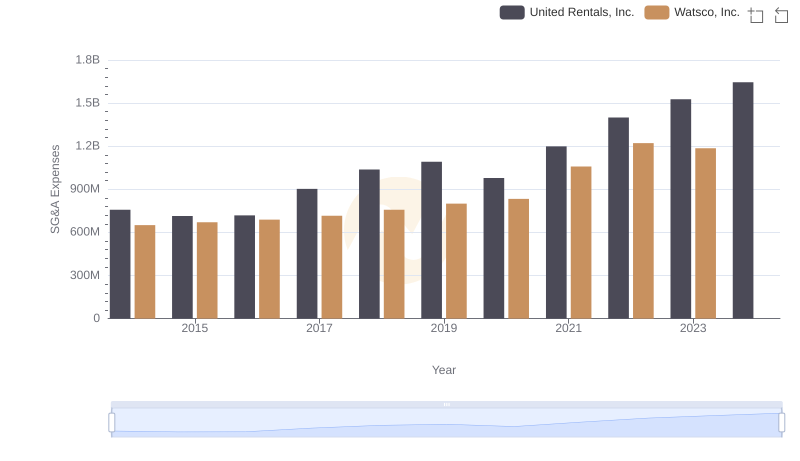
Cost Management Insights: SG&A Expenses for United Rentals, Inc. and Watsco, Inc.
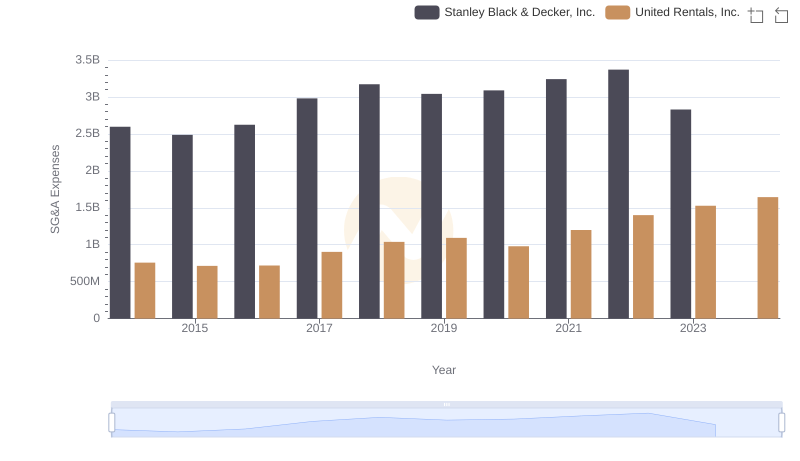
Selling, General, and Administrative Costs: United Rentals, Inc. vs Stanley Black & Decker, Inc.
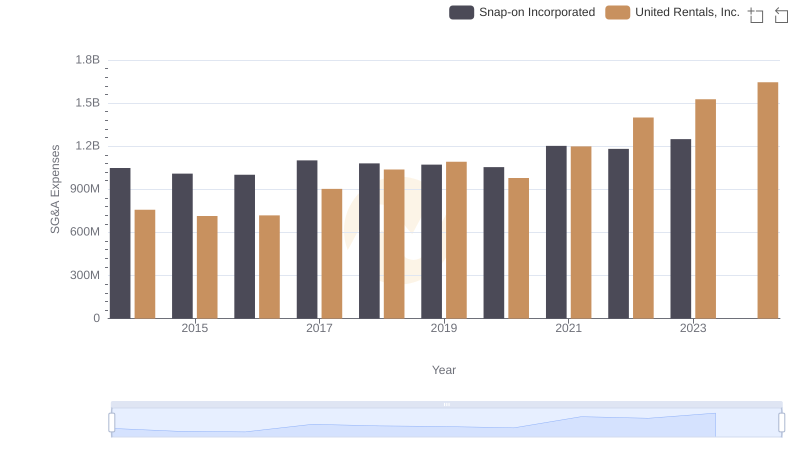
United Rentals, Inc. and Snap-on Incorporated: SG&A Spending Patterns Compared
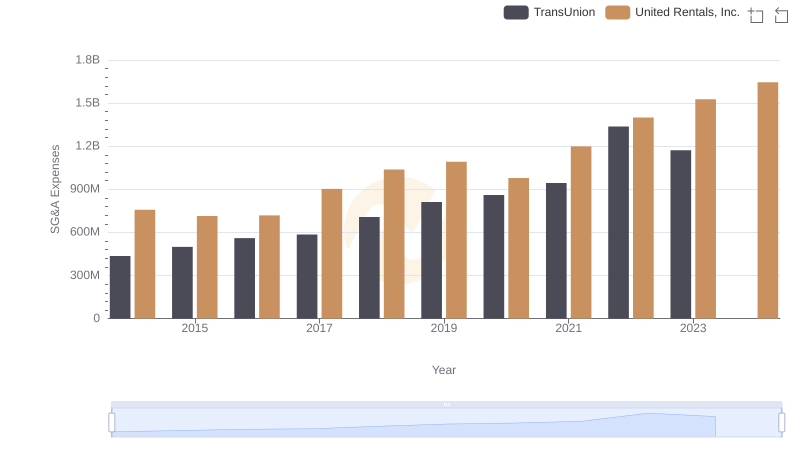
Breaking Down SG&A Expenses: United Rentals, Inc. vs TransUnion
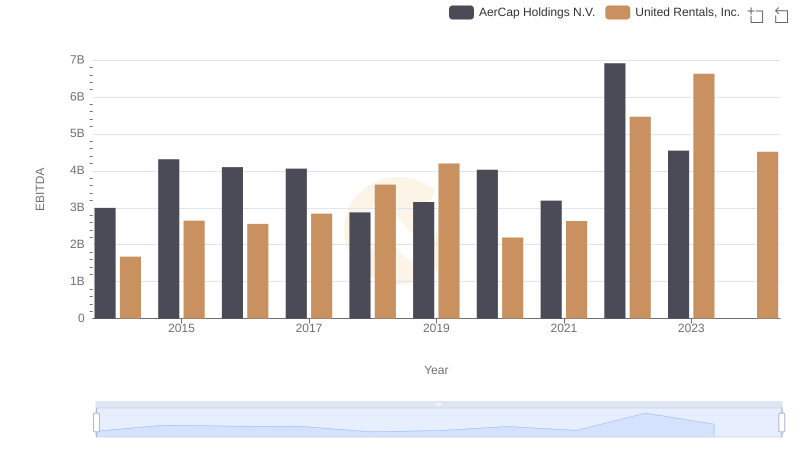
Comparative EBITDA Analysis: United Rentals, Inc. vs AerCap Holdings N.V.