| __timestamp | Stanley Black & Decker, Inc. | United Rentals, Inc. |
|---|---|---|
| Wednesday, January 1, 2014 | 1975400000 | 1678000000 |
| Thursday, January 1, 2015 | 1741900000 | 2653000000 |
| Friday, January 1, 2016 | 1810200000 | 2566000000 |
| Sunday, January 1, 2017 | 2196000000 | 2843000000 |
| Monday, January 1, 2018 | 1791200000 | 3628000000 |
| Tuesday, January 1, 2019 | 1920600000 | 4200000000 |
| Wednesday, January 1, 2020 | 2004200000 | 2195000000 |
| Friday, January 1, 2021 | 2345500000 | 2642000000 |
| Saturday, January 1, 2022 | 942800000 | 5464000000 |
| Sunday, January 1, 2023 | 802700000 | 6627000000 |
| Monday, January 1, 2024 | 286300000 | 4516000000 |
In pursuit of knowledge
In the ever-evolving landscape of industrial equipment and tools, United Rentals, Inc. and Stanley Black & Decker, Inc. have emerged as titans. Over the past decade, United Rentals has consistently outperformed Stanley Black & Decker in terms of EBITDA, showcasing a robust growth trajectory. From 2014 to 2023, United Rentals' EBITDA surged by nearly 295%, peaking in 2023, while Stanley Black & Decker experienced a more modest 59% increase, with a notable dip in 2022. This divergence highlights United Rentals' strategic prowess in capitalizing on market opportunities, whereas Stanley Black & Decker faced challenges in maintaining its growth momentum. As we look to the future, the missing data for 2024 leaves room for speculation on how these industry leaders will adapt to the ever-changing economic landscape.
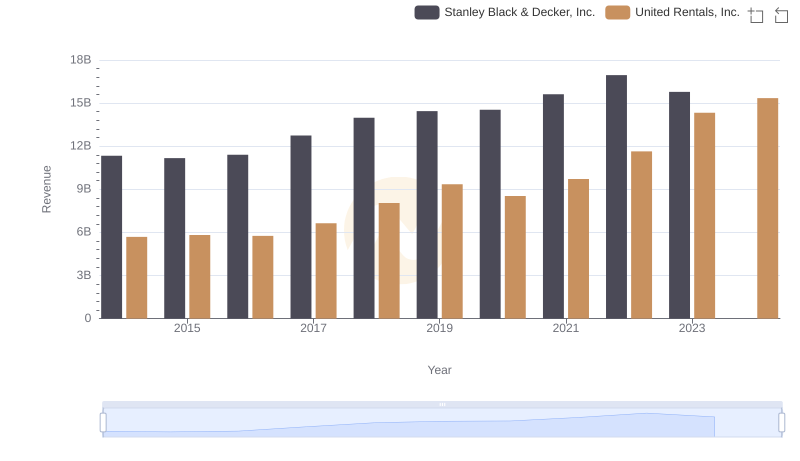
Comparing Revenue Performance: United Rentals, Inc. or Stanley Black & Decker, Inc.?
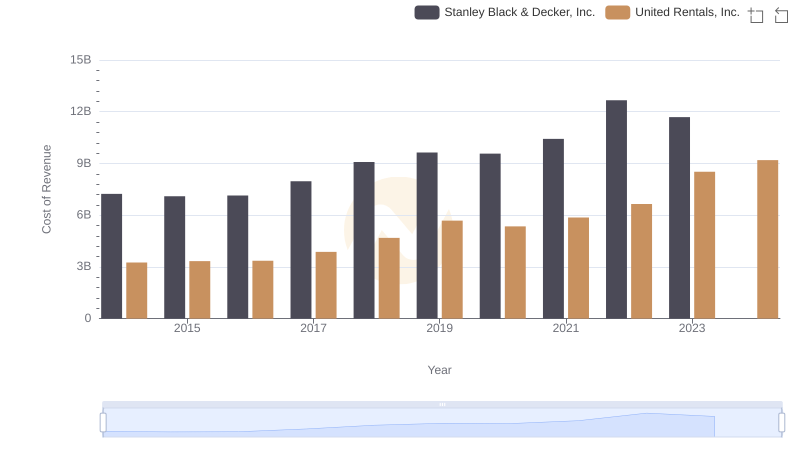
Cost of Revenue Comparison: United Rentals, Inc. vs Stanley Black & Decker, Inc.
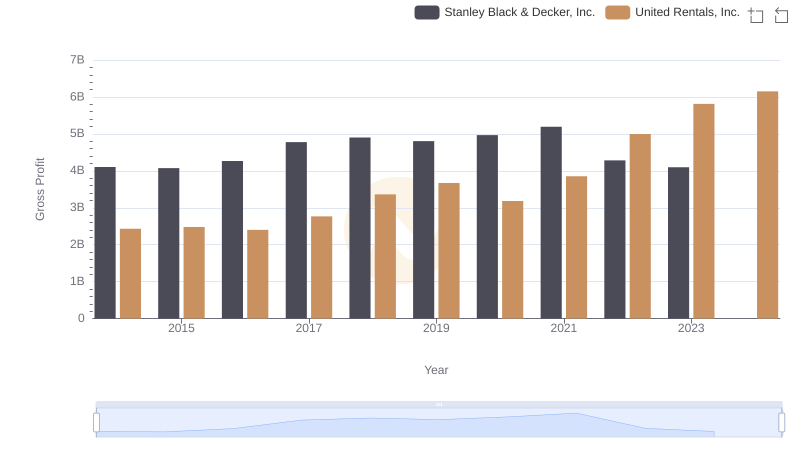
Gross Profit Analysis: Comparing United Rentals, Inc. and Stanley Black & Decker, Inc.

Selling, General, and Administrative Costs: United Rentals, Inc. vs Stanley Black & Decker, Inc.
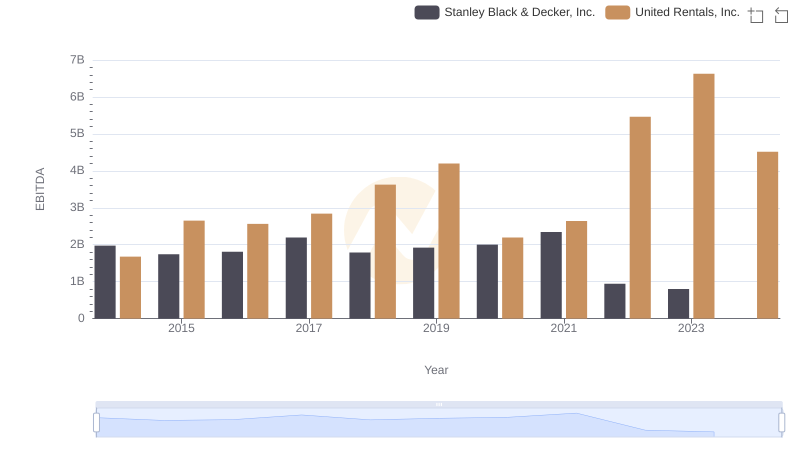
A Side-by-Side Analysis of EBITDA: United Rentals, Inc. and Stanley Black & Decker, Inc.

Breaking Down Revenue Trends: United Rentals, Inc. vs Stanley Black & Decker, Inc.

Comparing Cost of Revenue Efficiency: United Rentals, Inc. vs Stanley Black & Decker, Inc.

United Rentals, Inc. and Stanley Black & Decker, Inc.: A Detailed Gross Profit Analysis
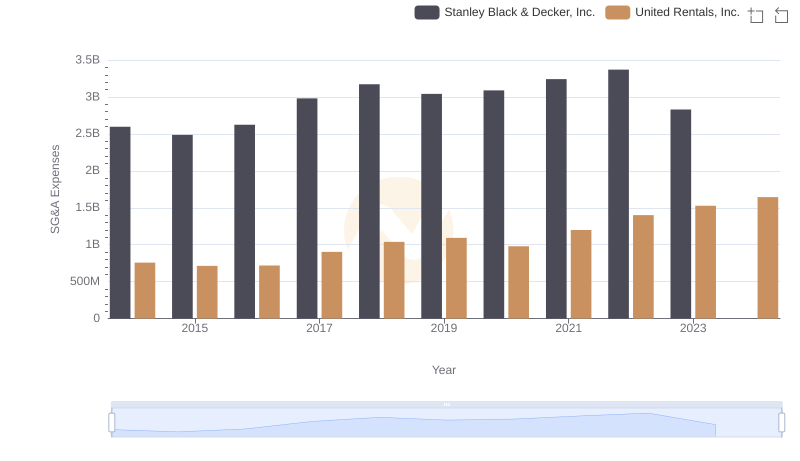
Cost Management Insights: SG&A Expenses for United Rentals, Inc. and Stanley Black & Decker, Inc.
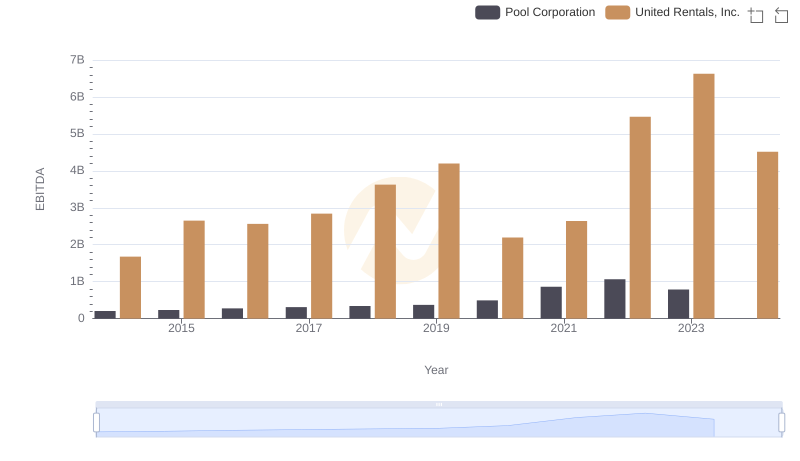
Comparative EBITDA Analysis: United Rentals, Inc. vs Pool Corporation