| __timestamp | Stanley Black & Decker, Inc. | United Rentals, Inc. |
|---|---|---|
| Wednesday, January 1, 2014 | 7235900000 | 3253000000 |
| Thursday, January 1, 2015 | 7099800000 | 3337000000 |
| Friday, January 1, 2016 | 7139700000 | 3359000000 |
| Sunday, January 1, 2017 | 7969200000 | 3872000000 |
| Monday, January 1, 2018 | 9080500000 | 4683000000 |
| Tuesday, January 1, 2019 | 9636700000 | 5681000000 |
| Wednesday, January 1, 2020 | 9566700000 | 5347000000 |
| Friday, January 1, 2021 | 10423000000 | 5863000000 |
| Saturday, January 1, 2022 | 12663300000 | 6646000000 |
| Sunday, January 1, 2023 | 11683100000 | 8519000000 |
| Monday, January 1, 2024 | 10851300000 | 9195000000 |
Cracking the code
In the ever-evolving landscape of industrial equipment and tools, United Rentals, Inc. and Stanley Black & Decker, Inc. stand as titans. Over the past decade, these companies have showcased contrasting trajectories in their cost of revenue. From 2014 to 2023, Stanley Black & Decker's cost of revenue surged by approximately 62%, peaking in 2022. Meanwhile, United Rentals experienced a robust growth of around 162% during the same period, reflecting its aggressive expansion strategy.
Interestingly, 2023 marked a pivotal year where United Rentals' cost of revenue approached 73% of Stanley Black & Decker's, highlighting its rapid ascent in the industry. However, data for 2024 remains elusive, leaving analysts and investors eagerly anticipating the next chapter in this financial narrative. As these industry leaders continue to innovate and expand, their financial strategies will undoubtedly shape the future of the sector.
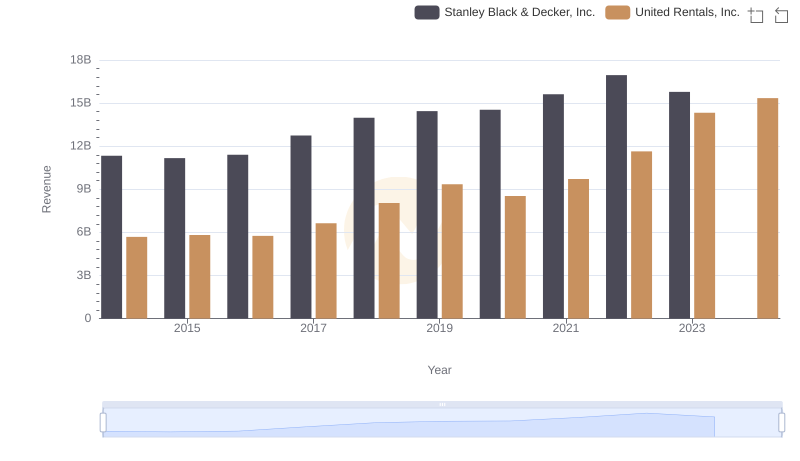
Comparing Revenue Performance: United Rentals, Inc. or Stanley Black & Decker, Inc.?
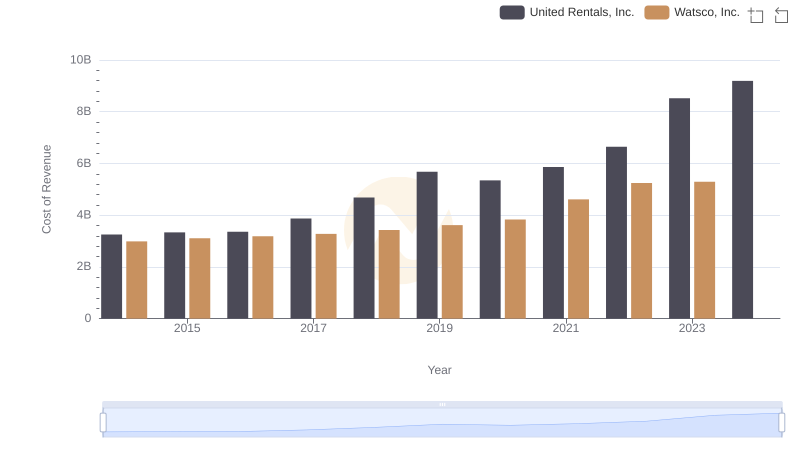
United Rentals, Inc. vs Watsco, Inc.: Efficiency in Cost of Revenue Explored
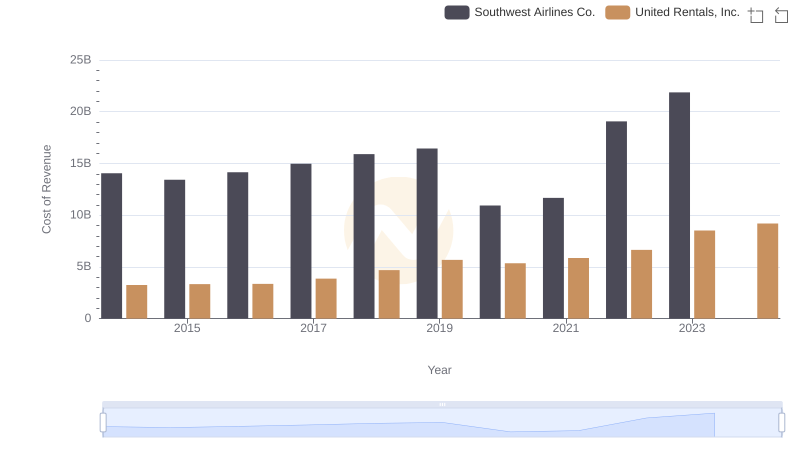
Cost Insights: Breaking Down United Rentals, Inc. and Southwest Airlines Co.'s Expenses
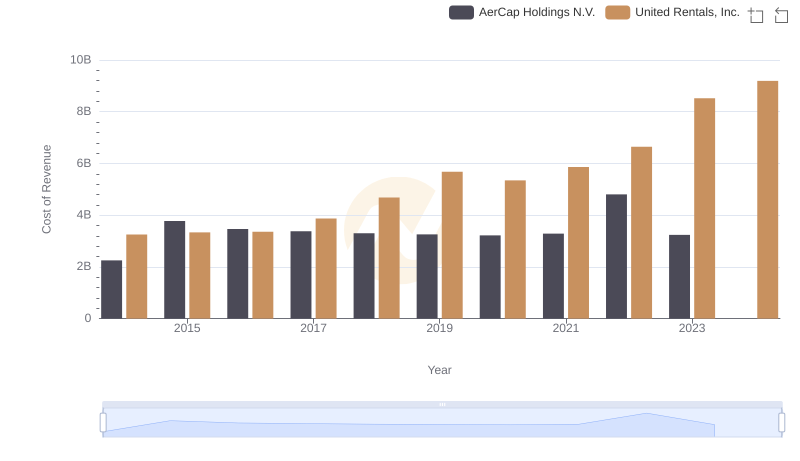
Cost Insights: Breaking Down United Rentals, Inc. and AerCap Holdings N.V.'s Expenses
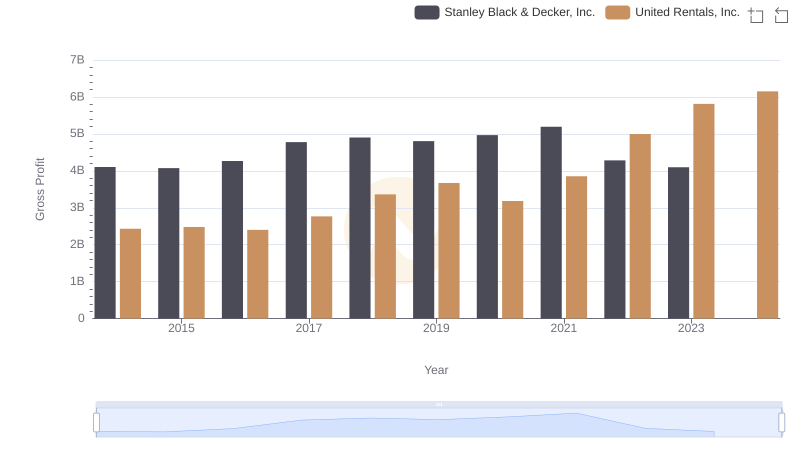
Gross Profit Analysis: Comparing United Rentals, Inc. and Stanley Black & Decker, Inc.

Selling, General, and Administrative Costs: United Rentals, Inc. vs Stanley Black & Decker, Inc.
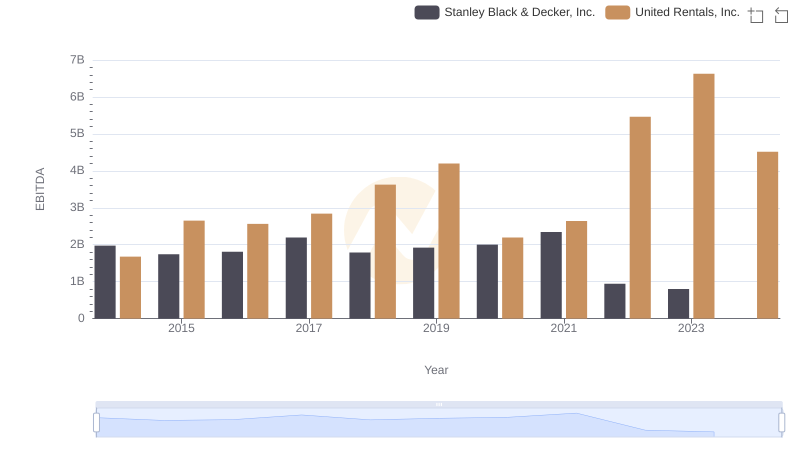
A Side-by-Side Analysis of EBITDA: United Rentals, Inc. and Stanley Black & Decker, Inc.

Breaking Down Revenue Trends: United Rentals, Inc. vs Stanley Black & Decker, Inc.
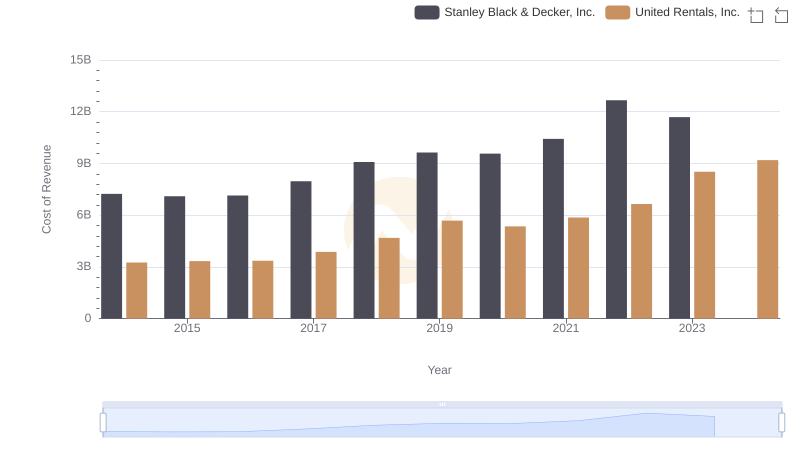
Comparing Cost of Revenue Efficiency: United Rentals, Inc. vs Stanley Black & Decker, Inc.

United Rentals, Inc. and Stanley Black & Decker, Inc.: A Detailed Gross Profit Analysis
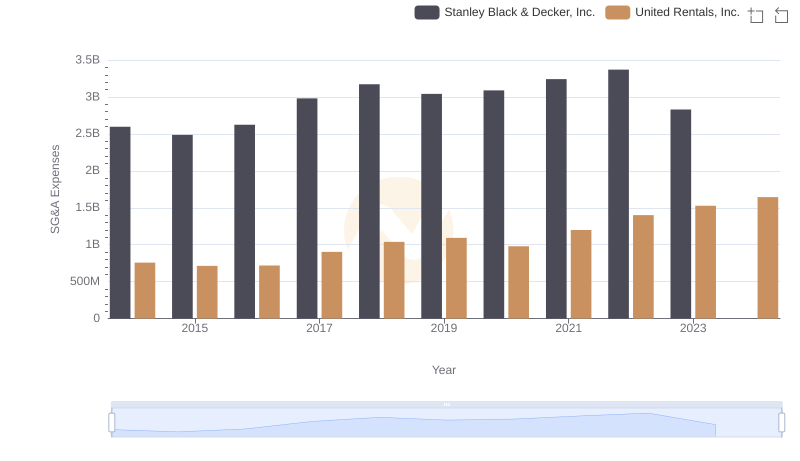
Cost Management Insights: SG&A Expenses for United Rentals, Inc. and Stanley Black & Decker, Inc.

Comprehensive EBITDA Comparison: United Rentals, Inc. vs Stanley Black & Decker, Inc.