| __timestamp | Stanley Black & Decker, Inc. | United Rentals, Inc. |
|---|---|---|
| Wednesday, January 1, 2014 | 2595900000 | 758000000 |
| Thursday, January 1, 2015 | 2486400000 | 714000000 |
| Friday, January 1, 2016 | 2623900000 | 719000000 |
| Sunday, January 1, 2017 | 2980100000 | 903000000 |
| Monday, January 1, 2018 | 3171700000 | 1038000000 |
| Tuesday, January 1, 2019 | 3041000000 | 1092000000 |
| Wednesday, January 1, 2020 | 3089600000 | 979000000 |
| Friday, January 1, 2021 | 3240400000 | 1199000000 |
| Saturday, January 1, 2022 | 3370000000 | 1400000000 |
| Sunday, January 1, 2023 | 2829300000 | 1527000000 |
| Monday, January 1, 2024 | 3310500000 | 1645000000 |
Data in motion
In the ever-evolving landscape of corporate finance, understanding cost management is crucial for maintaining profitability. This analysis delves into the Selling, General, and Administrative (SG&A) expenses of two industry giants: United Rentals, Inc. and Stanley Black & Decker, Inc., from 2014 to 2023.
Over the past decade, Stanley Black & Decker, Inc. has consistently managed higher SG&A expenses compared to United Rentals, Inc. In 2022, Stanley Black & Decker's SG&A expenses peaked at approximately 3.37 billion, marking a 35% increase from 2014. Conversely, United Rentals, Inc. saw a significant rise in their SG&A expenses, reaching 1.53 billion in 2023, a 101% increase since 2014.
These trends highlight the strategic focus of each company. While Stanley Black & Decker's expenses reflect a stable yet high-cost structure, United Rentals' rapid increase suggests aggressive expansion strategies. Notably, 2024 data for Stanley Black & Decker is missing, indicating potential reporting delays or strategic shifts.
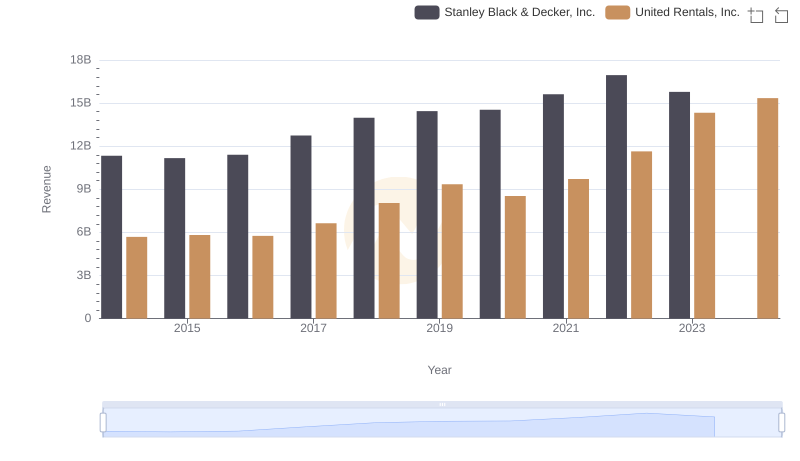
Comparing Revenue Performance: United Rentals, Inc. or Stanley Black & Decker, Inc.?
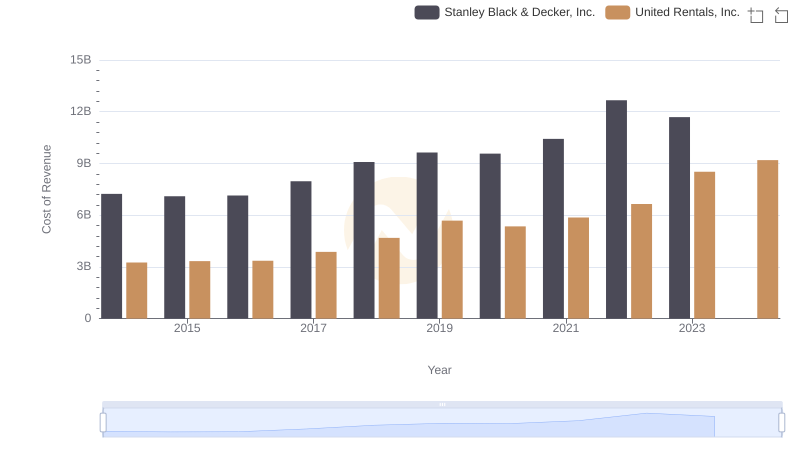
Cost of Revenue Comparison: United Rentals, Inc. vs Stanley Black & Decker, Inc.
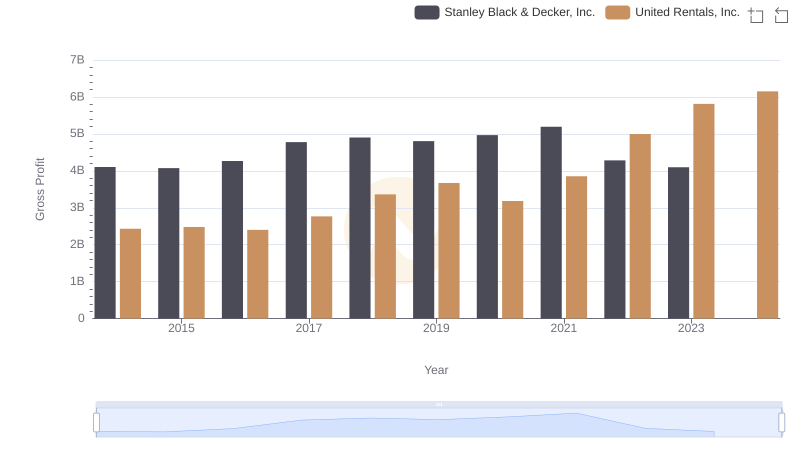
Gross Profit Analysis: Comparing United Rentals, Inc. and Stanley Black & Decker, Inc.
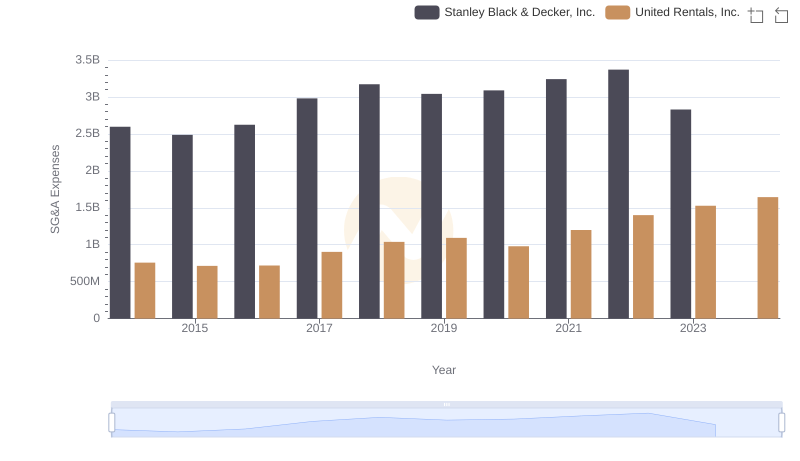
Selling, General, and Administrative Costs: United Rentals, Inc. vs Stanley Black & Decker, Inc.
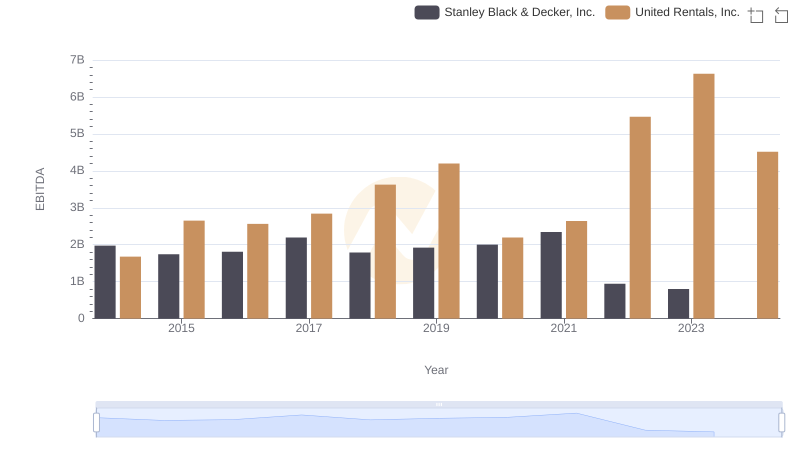
A Side-by-Side Analysis of EBITDA: United Rentals, Inc. and Stanley Black & Decker, Inc.

Breaking Down Revenue Trends: United Rentals, Inc. vs Stanley Black & Decker, Inc.

Comparing Cost of Revenue Efficiency: United Rentals, Inc. vs Stanley Black & Decker, Inc.

United Rentals, Inc. and Stanley Black & Decker, Inc.: A Detailed Gross Profit Analysis
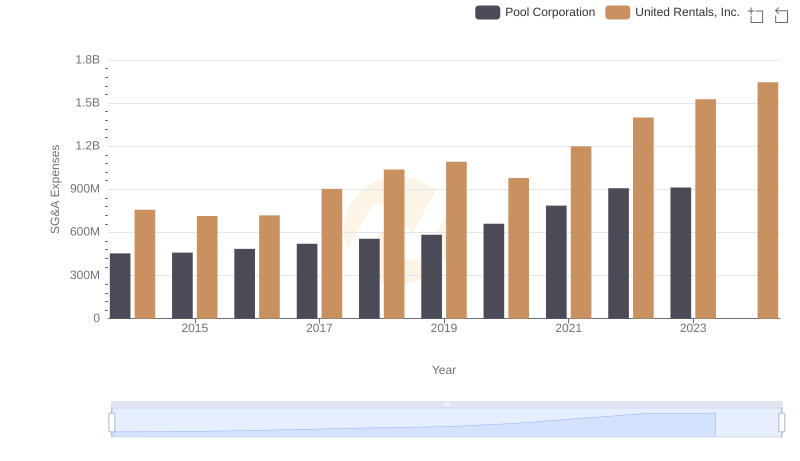
Cost Management Insights: SG&A Expenses for United Rentals, Inc. and Pool Corporation
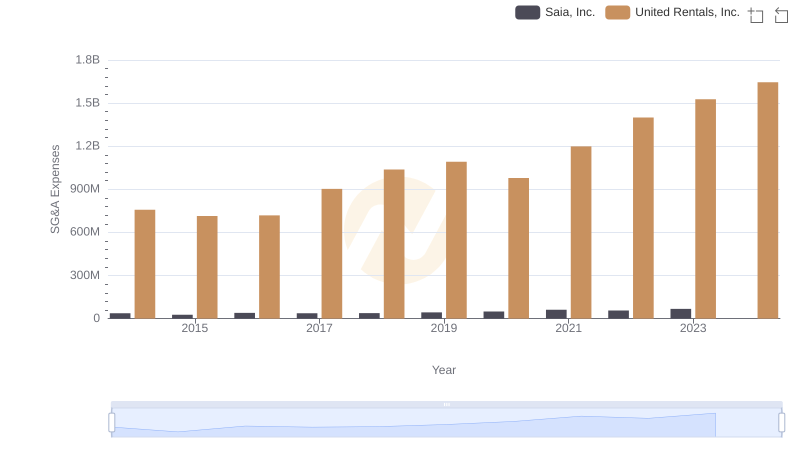
Breaking Down SG&A Expenses: United Rentals, Inc. vs Saia, Inc.
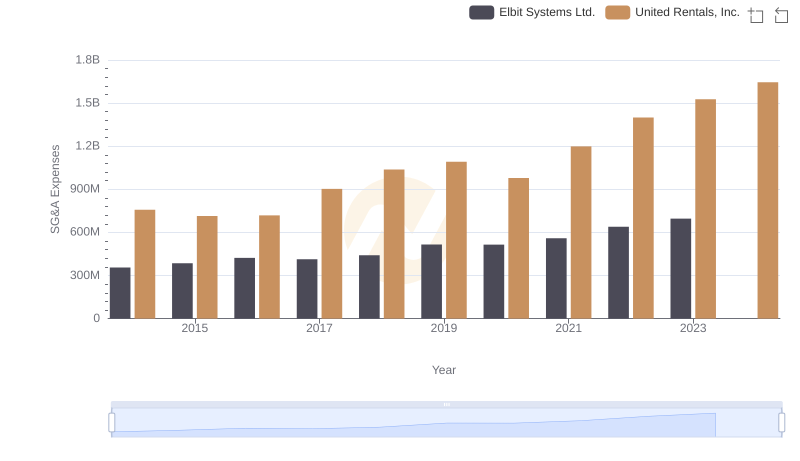
Operational Costs Compared: SG&A Analysis of United Rentals, Inc. and Elbit Systems Ltd.

Comprehensive EBITDA Comparison: United Rentals, Inc. vs Stanley Black & Decker, Inc.