| __timestamp | Stanley Black & Decker, Inc. | United Rentals, Inc. |
|---|---|---|
| Wednesday, January 1, 2014 | 7235900000 | 3253000000 |
| Thursday, January 1, 2015 | 7099800000 | 3337000000 |
| Friday, January 1, 2016 | 7139700000 | 3359000000 |
| Sunday, January 1, 2017 | 7969200000 | 3872000000 |
| Monday, January 1, 2018 | 9080500000 | 4683000000 |
| Tuesday, January 1, 2019 | 9636700000 | 5681000000 |
| Wednesday, January 1, 2020 | 9566700000 | 5347000000 |
| Friday, January 1, 2021 | 10423000000 | 5863000000 |
| Saturday, January 1, 2022 | 12663300000 | 6646000000 |
| Sunday, January 1, 2023 | 11683100000 | 8519000000 |
| Monday, January 1, 2024 | 10851300000 | 9195000000 |
Unleashing insights
In the ever-evolving landscape of industrial giants, United Rentals, Inc. and Stanley Black & Decker, Inc. stand as titans in their respective fields. Over the past decade, these companies have showcased distinct trajectories in cost efficiency. From 2014 to 2023, Stanley Black & Decker's cost of revenue surged by approximately 61%, peaking in 2022. Meanwhile, United Rentals demonstrated a more consistent growth, with a notable 162% increase over the same period, reaching its zenith in 2024. This divergence highlights the contrasting strategies and market dynamics influencing each company. While Stanley Black & Decker faced fluctuations, United Rentals capitalized on steady expansion, particularly in the latter years. As we look to the future, the absence of data for Stanley Black & Decker in 2024 leaves room for speculation on its next strategic move.
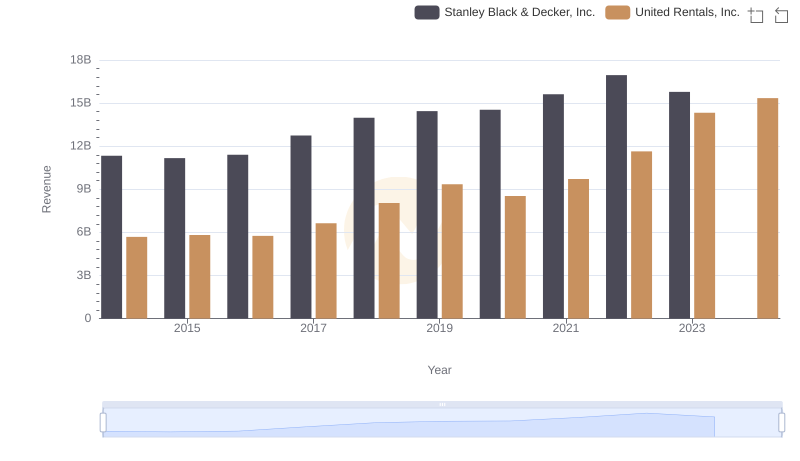
Comparing Revenue Performance: United Rentals, Inc. or Stanley Black & Decker, Inc.?
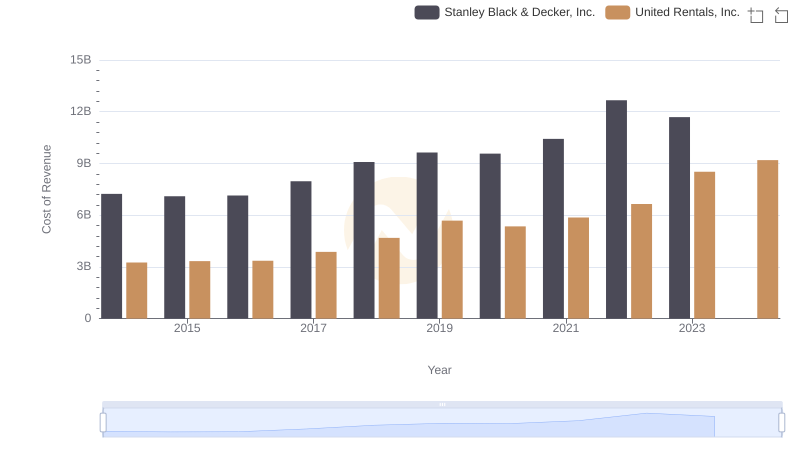
Cost of Revenue Comparison: United Rentals, Inc. vs Stanley Black & Decker, Inc.
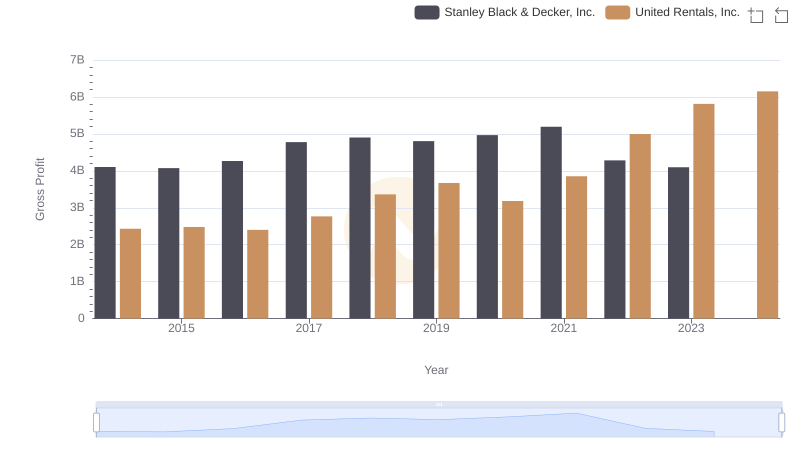
Gross Profit Analysis: Comparing United Rentals, Inc. and Stanley Black & Decker, Inc.
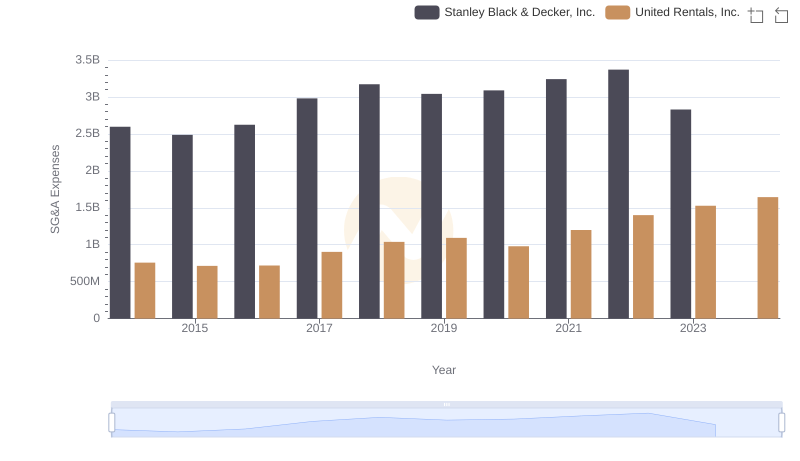
Selling, General, and Administrative Costs: United Rentals, Inc. vs Stanley Black & Decker, Inc.
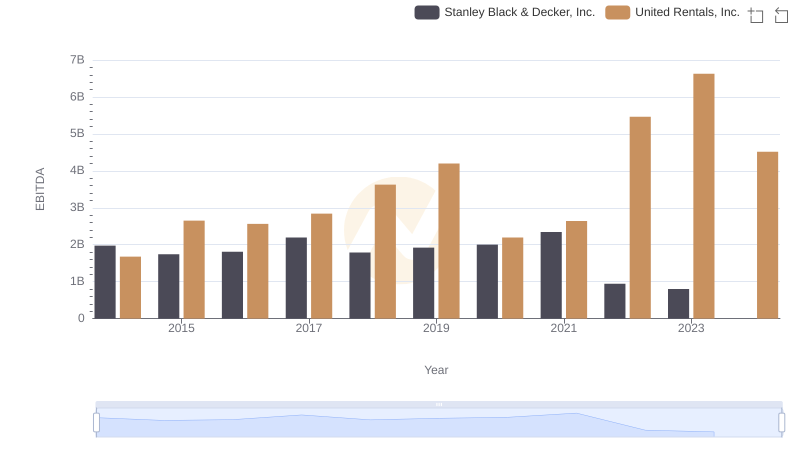
A Side-by-Side Analysis of EBITDA: United Rentals, Inc. and Stanley Black & Decker, Inc.

Breaking Down Revenue Trends: United Rentals, Inc. vs Stanley Black & Decker, Inc.
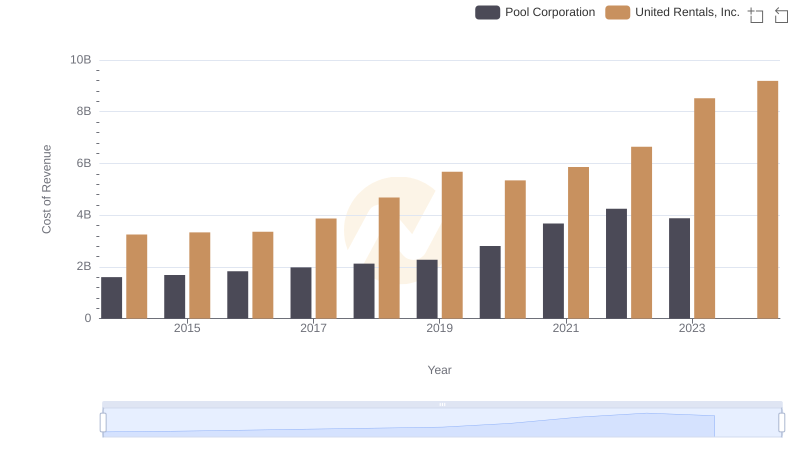
United Rentals, Inc. vs Pool Corporation: Efficiency in Cost of Revenue Explored
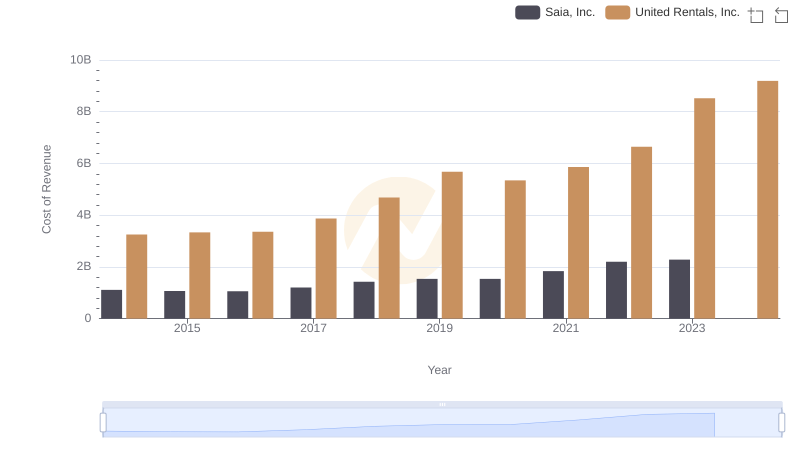
Cost of Revenue Comparison: United Rentals, Inc. vs Saia, Inc.
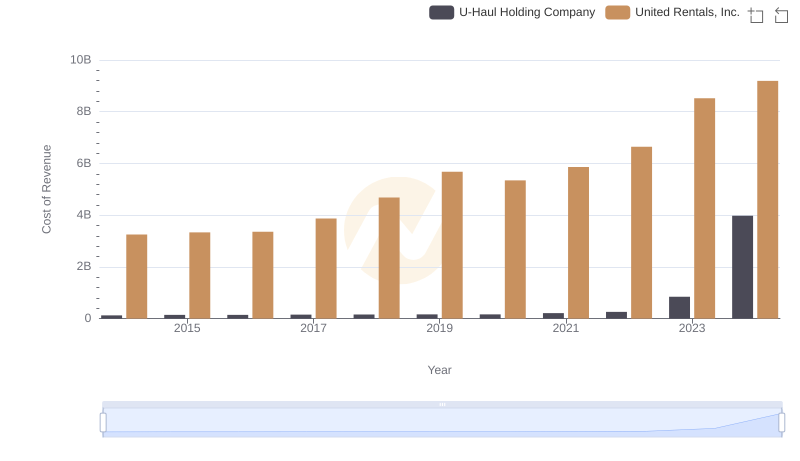
Cost of Revenue Comparison: United Rentals, Inc. vs U-Haul Holding Company

United Rentals, Inc. and Stanley Black & Decker, Inc.: A Detailed Gross Profit Analysis
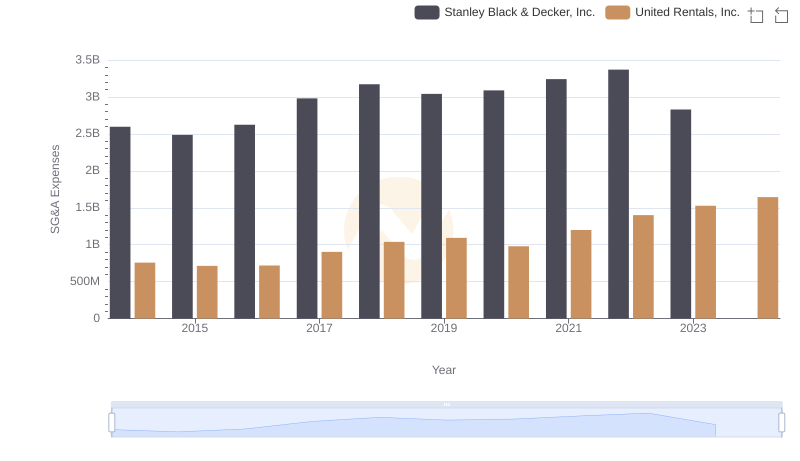
Cost Management Insights: SG&A Expenses for United Rentals, Inc. and Stanley Black & Decker, Inc.

Comprehensive EBITDA Comparison: United Rentals, Inc. vs Stanley Black & Decker, Inc.