| __timestamp | Stanley Black & Decker, Inc. | United Rentals, Inc. |
|---|---|---|
| Wednesday, January 1, 2014 | 11338600000 | 5685000000 |
| Thursday, January 1, 2015 | 11171800000 | 5817000000 |
| Friday, January 1, 2016 | 11406900000 | 5762000000 |
| Sunday, January 1, 2017 | 12747200000 | 6641000000 |
| Monday, January 1, 2018 | 13982400000 | 8047000000 |
| Tuesday, January 1, 2019 | 14442200000 | 9351000000 |
| Wednesday, January 1, 2020 | 14534600000 | 8530000000 |
| Friday, January 1, 2021 | 15617200000 | 9716000000 |
| Saturday, January 1, 2022 | 16947400000 | 11642000000 |
| Sunday, January 1, 2023 | 15781100000 | 14332000000 |
| Monday, January 1, 2024 | 15365700000 | 15345000000 |
In pursuit of knowledge
In the ever-evolving landscape of industrial services and tools, United Rentals, Inc. and Stanley Black & Decker, Inc. have showcased intriguing revenue trajectories over the past decade. From 2014 to 2023, Stanley Black & Decker's revenue grew by approximately 39%, peaking in 2022. However, 2023 saw a slight dip, indicating potential market challenges or strategic shifts. Meanwhile, United Rentals demonstrated a robust growth of around 152% during the same period, with a consistent upward trend, culminating in a record high in 2024. This stark contrast highlights United Rentals' aggressive expansion and market capture strategies, while Stanley Black & Decker's steadier growth reflects its established market presence. The missing data for Stanley Black & Decker in 2024 suggests a need for further analysis to understand future trends. These insights provide a compelling narrative of competition and growth in the industrial sector.
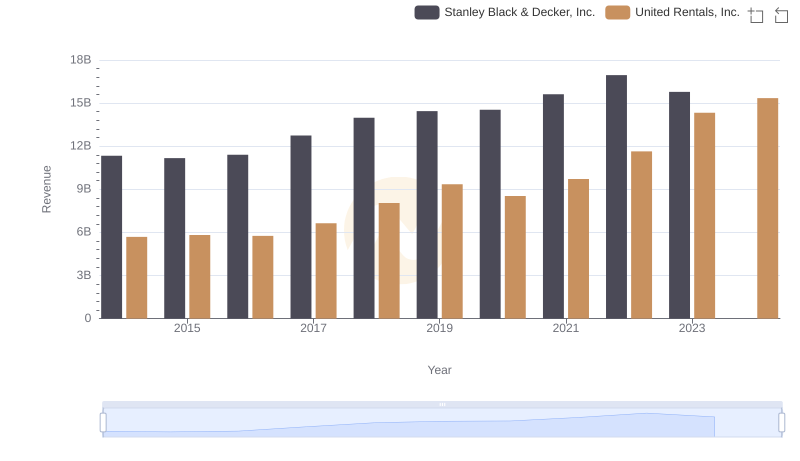
Comparing Revenue Performance: United Rentals, Inc. or Stanley Black & Decker, Inc.?
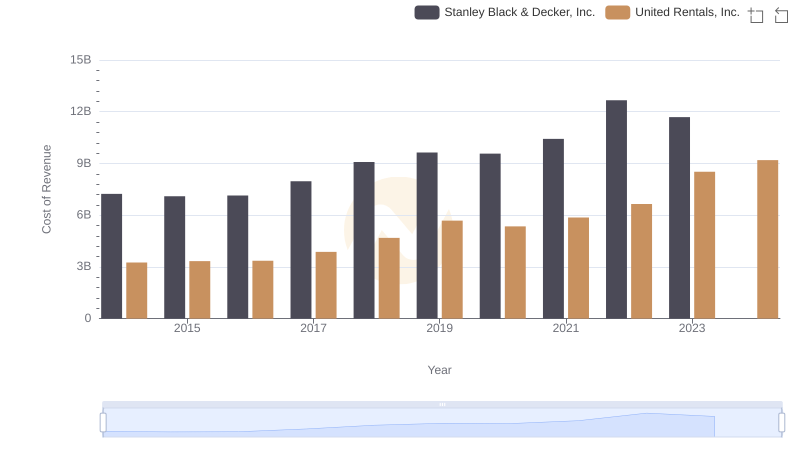
Cost of Revenue Comparison: United Rentals, Inc. vs Stanley Black & Decker, Inc.
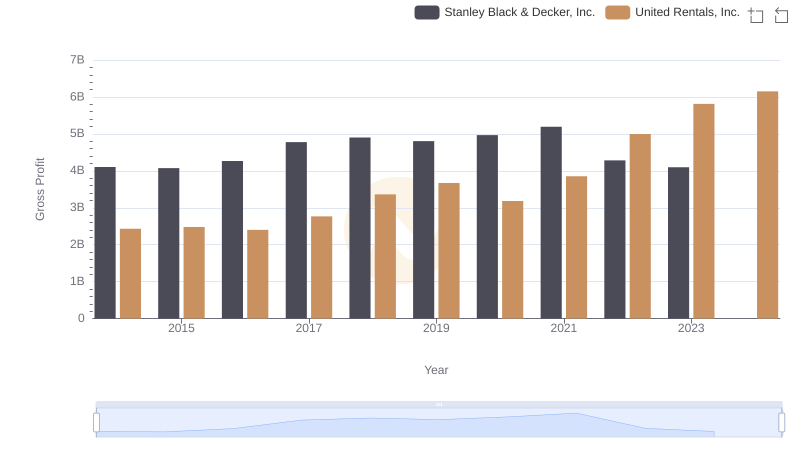
Gross Profit Analysis: Comparing United Rentals, Inc. and Stanley Black & Decker, Inc.

Selling, General, and Administrative Costs: United Rentals, Inc. vs Stanley Black & Decker, Inc.
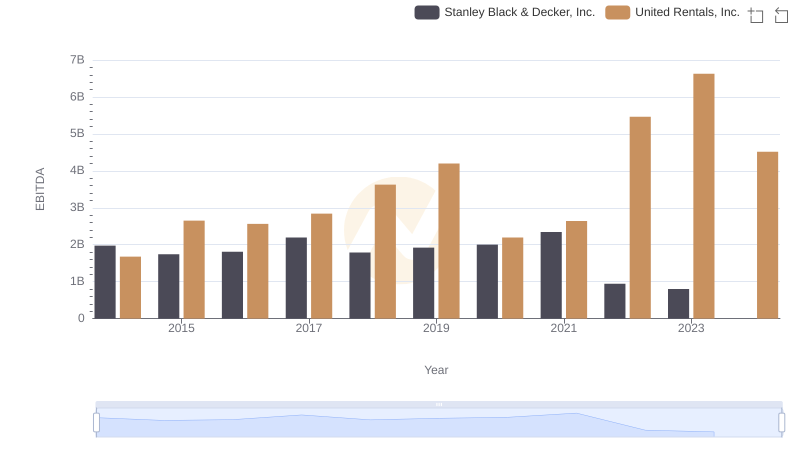
A Side-by-Side Analysis of EBITDA: United Rentals, Inc. and Stanley Black & Decker, Inc.
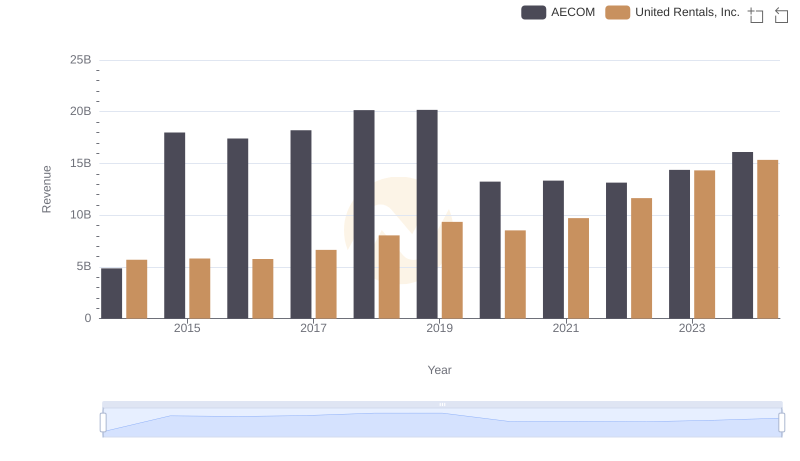
United Rentals, Inc. or AECOM: Who Leads in Yearly Revenue?
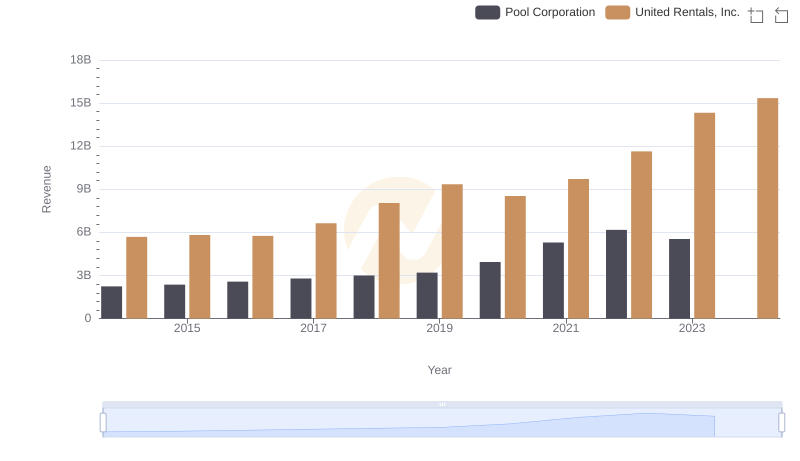
Annual Revenue Comparison: United Rentals, Inc. vs Pool Corporation

Breaking Down Revenue Trends: United Rentals, Inc. vs Saia, Inc.

Comparing Cost of Revenue Efficiency: United Rentals, Inc. vs Stanley Black & Decker, Inc.

United Rentals, Inc. and Stanley Black & Decker, Inc.: A Detailed Gross Profit Analysis
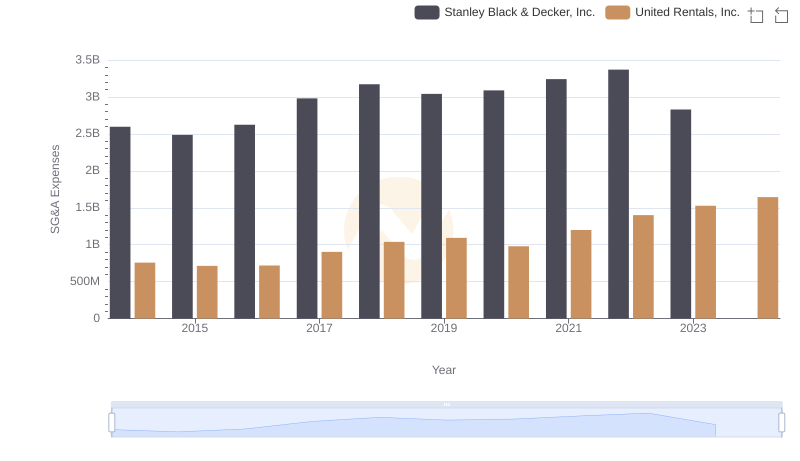
Cost Management Insights: SG&A Expenses for United Rentals, Inc. and Stanley Black & Decker, Inc.

Comprehensive EBITDA Comparison: United Rentals, Inc. vs Stanley Black & Decker, Inc.