| __timestamp | Stanley Black & Decker, Inc. | United Rentals, Inc. |
|---|---|---|
| Wednesday, January 1, 2014 | 4102700000 | 2432000000 |
| Thursday, January 1, 2015 | 4072000000 | 2480000000 |
| Friday, January 1, 2016 | 4267200000 | 2403000000 |
| Sunday, January 1, 2017 | 4778000000 | 2769000000 |
| Monday, January 1, 2018 | 4901900000 | 3364000000 |
| Tuesday, January 1, 2019 | 4805500000 | 3670000000 |
| Wednesday, January 1, 2020 | 4967900000 | 3183000000 |
| Friday, January 1, 2021 | 5194200000 | 3853000000 |
| Saturday, January 1, 2022 | 4284100000 | 4996000000 |
| Sunday, January 1, 2023 | 4098000000 | 5813000000 |
| Monday, January 1, 2024 | 4514400000 | 6150000000 |
Data in motion
In the ever-evolving landscape of industrial giants, United Rentals, Inc. and Stanley Black & Decker, Inc. have showcased intriguing financial trajectories over the past decade. From 2014 to 2023, Stanley Black & Decker maintained a relatively stable gross profit, peaking in 2021 with a 15% increase from 2014. However, a notable dip occurred in 2022, reflecting broader market challenges.
Conversely, United Rentals demonstrated a robust growth pattern, with gross profit surging by approximately 139% from 2014 to 2023. This growth trajectory highlights United Rentals' strategic market positioning and operational efficiency. The data for 2024 remains incomplete, yet the trend suggests continued upward momentum for United Rentals.
This comparative analysis underscores the dynamic nature of the industrial sector, where strategic decisions and market adaptability play pivotal roles in financial performance.
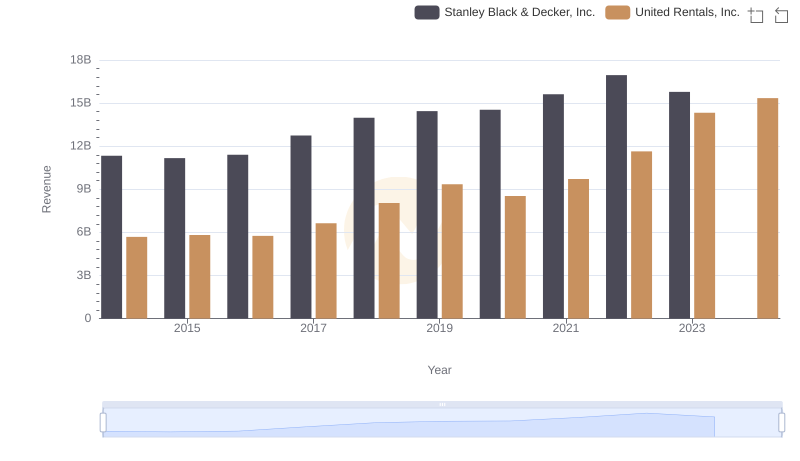
Comparing Revenue Performance: United Rentals, Inc. or Stanley Black & Decker, Inc.?
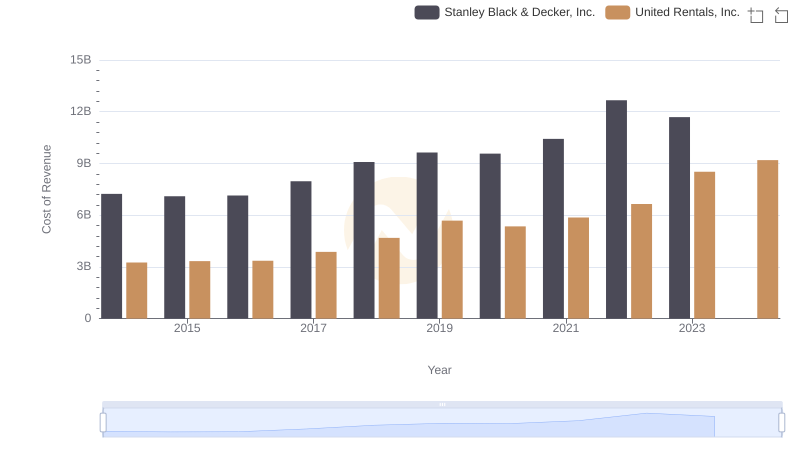
Cost of Revenue Comparison: United Rentals, Inc. vs Stanley Black & Decker, Inc.
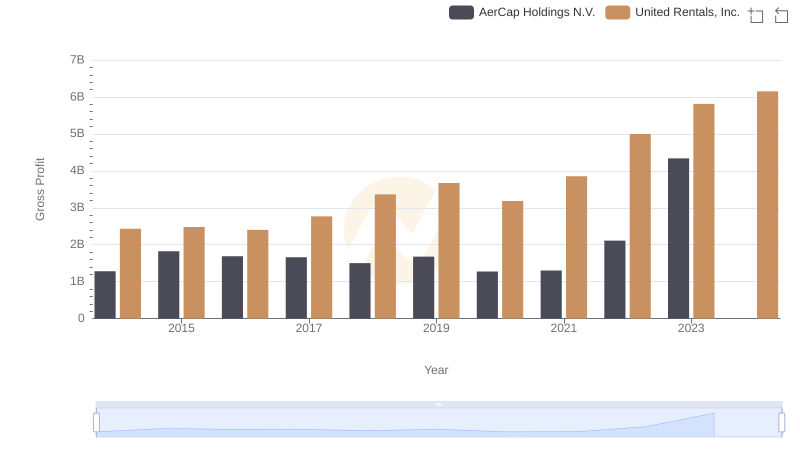
Gross Profit Analysis: Comparing United Rentals, Inc. and AerCap Holdings N.V.
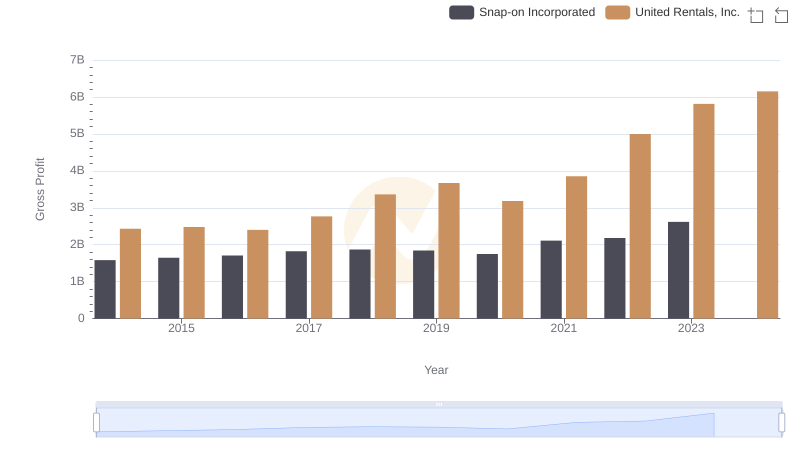
Gross Profit Analysis: Comparing United Rentals, Inc. and Snap-on Incorporated
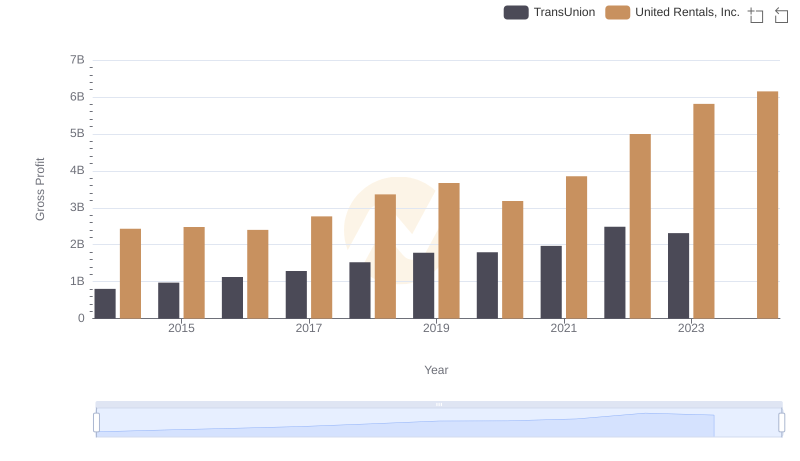
United Rentals, Inc. and TransUnion: A Detailed Gross Profit Analysis

Selling, General, and Administrative Costs: United Rentals, Inc. vs Stanley Black & Decker, Inc.
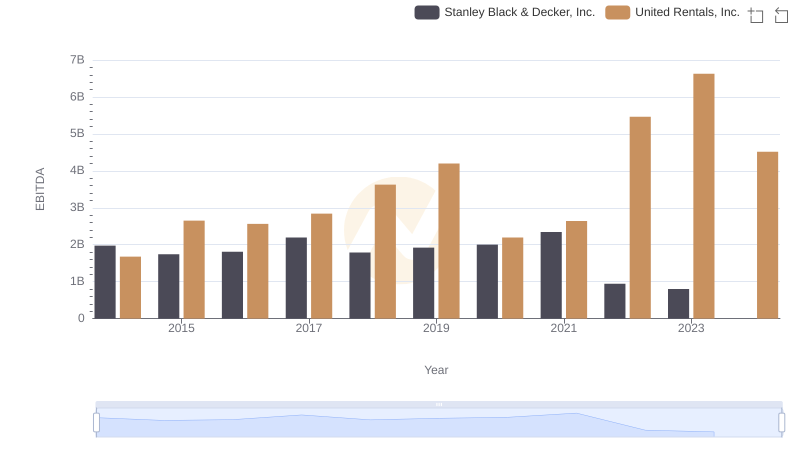
A Side-by-Side Analysis of EBITDA: United Rentals, Inc. and Stanley Black & Decker, Inc.

Breaking Down Revenue Trends: United Rentals, Inc. vs Stanley Black & Decker, Inc.

Comparing Cost of Revenue Efficiency: United Rentals, Inc. vs Stanley Black & Decker, Inc.

United Rentals, Inc. and Stanley Black & Decker, Inc.: A Detailed Gross Profit Analysis
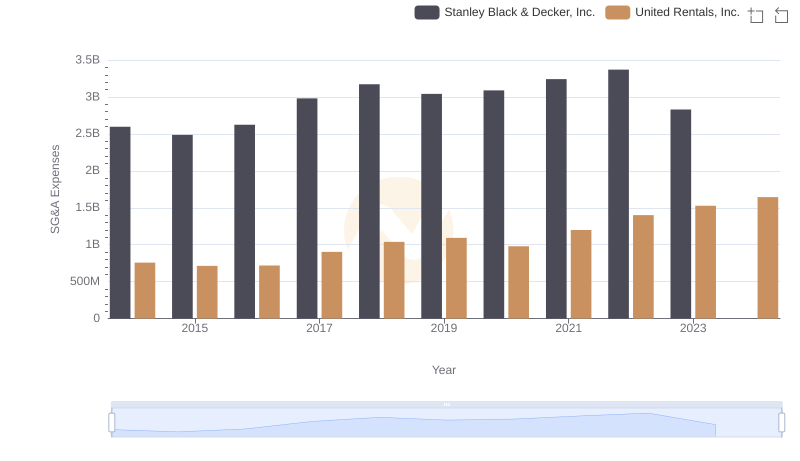
Cost Management Insights: SG&A Expenses for United Rentals, Inc. and Stanley Black & Decker, Inc.

Comprehensive EBITDA Comparison: United Rentals, Inc. vs Stanley Black & Decker, Inc.