| __timestamp | Fastenal Company | United Rentals, Inc. |
|---|---|---|
| Wednesday, January 1, 2014 | 1110776000 | 758000000 |
| Thursday, January 1, 2015 | 1121590000 | 714000000 |
| Friday, January 1, 2016 | 1169470000 | 719000000 |
| Sunday, January 1, 2017 | 1282800000 | 903000000 |
| Monday, January 1, 2018 | 1400200000 | 1038000000 |
| Tuesday, January 1, 2019 | 1459400000 | 1092000000 |
| Wednesday, January 1, 2020 | 1427400000 | 979000000 |
| Friday, January 1, 2021 | 1559800000 | 1199000000 |
| Saturday, January 1, 2022 | 1762200000 | 1400000000 |
| Sunday, January 1, 2023 | 1825800000 | 1527000000 |
| Monday, January 1, 2024 | 1891900000 | 1645000000 |
Igniting the spark of knowledge
In the competitive landscape of industrial services, understanding the financial dynamics of key players is crucial. Over the past decade, United Rentals, Inc. and Fastenal Company have showcased intriguing trends in their Selling, General, and Administrative (SG&A) expenses. From 2014 to 2024, Fastenal's SG&A expenses have surged by approximately 70%, reflecting its aggressive expansion and operational strategies. In contrast, United Rentals has seen a more moderate increase of around 117%, indicating a steady growth trajectory.
These trends underscore the diverse strategies employed by these industry giants to maintain their competitive edge.
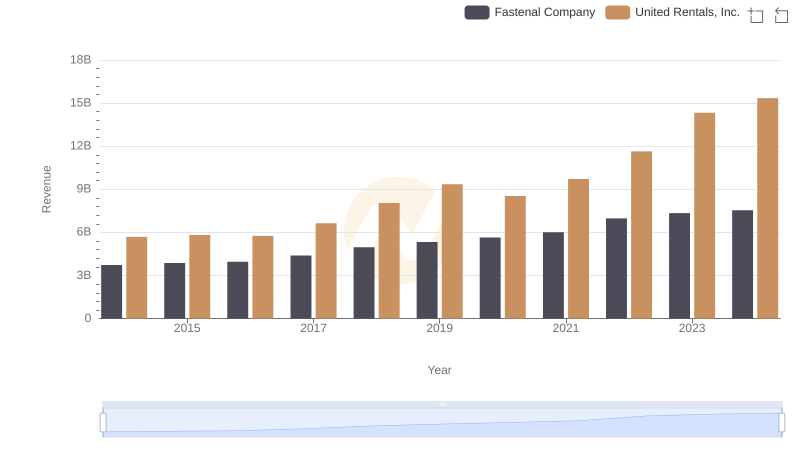
Revenue Showdown: United Rentals, Inc. vs Fastenal Company
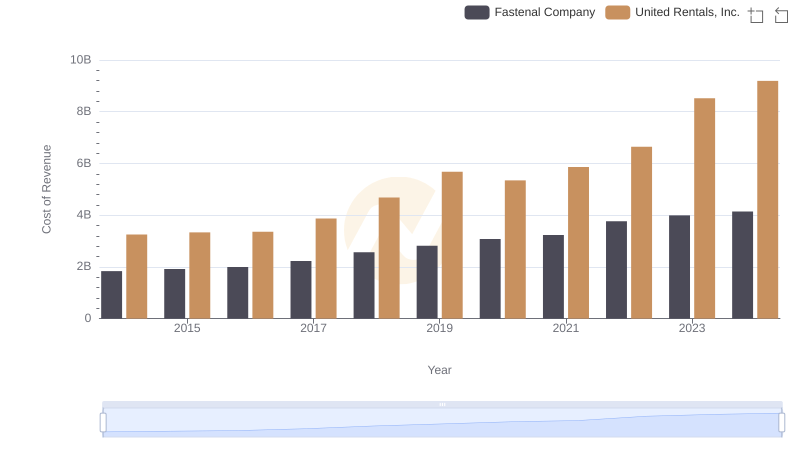
Cost Insights: Breaking Down United Rentals, Inc. and Fastenal Company's Expenses
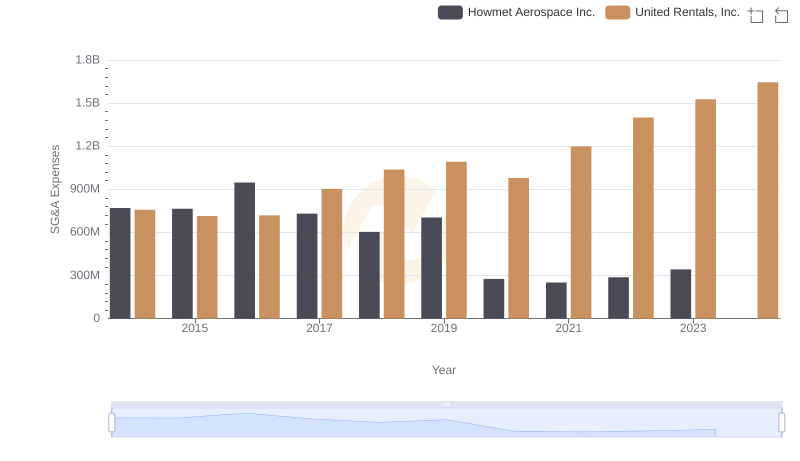
Operational Costs Compared: SG&A Analysis of United Rentals, Inc. and Howmet Aerospace Inc.
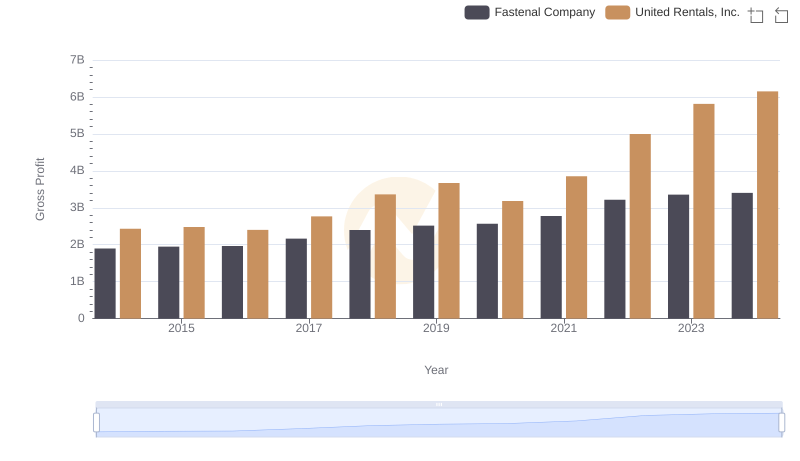
Gross Profit Comparison: United Rentals, Inc. and Fastenal Company Trends
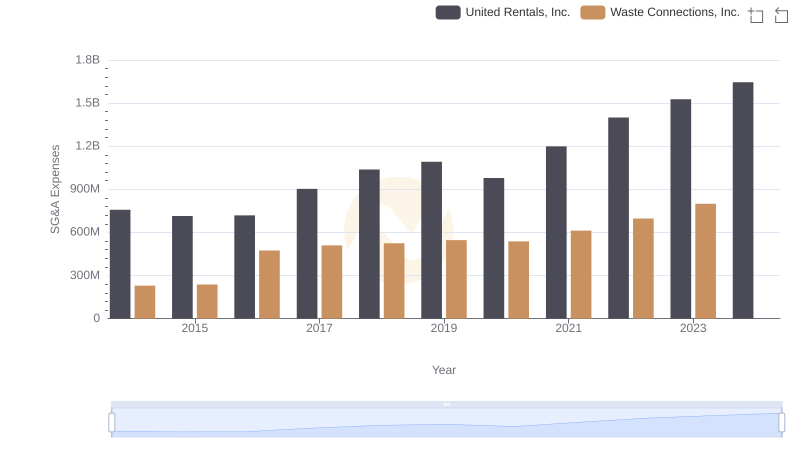
Selling, General, and Administrative Costs: United Rentals, Inc. vs Waste Connections, Inc.
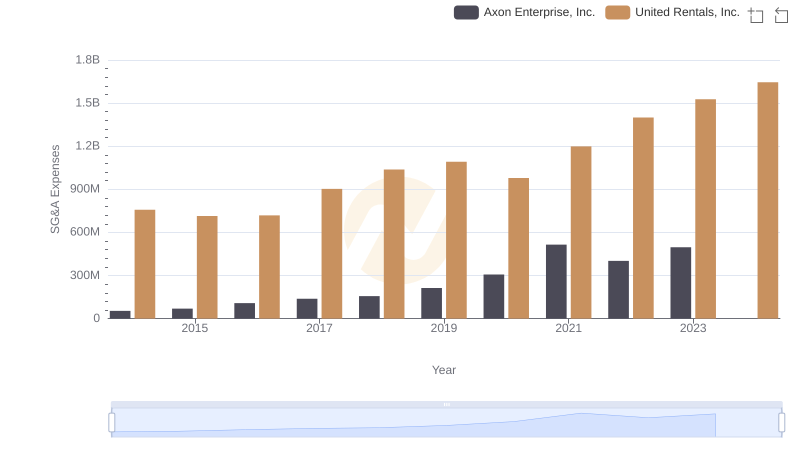
Comparing SG&A Expenses: United Rentals, Inc. vs Axon Enterprise, Inc. Trends and Insights
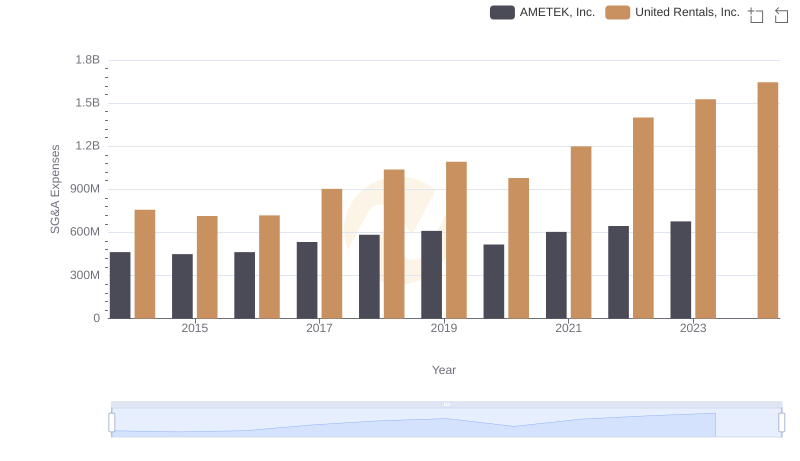
United Rentals, Inc. vs AMETEK, Inc.: SG&A Expense Trends
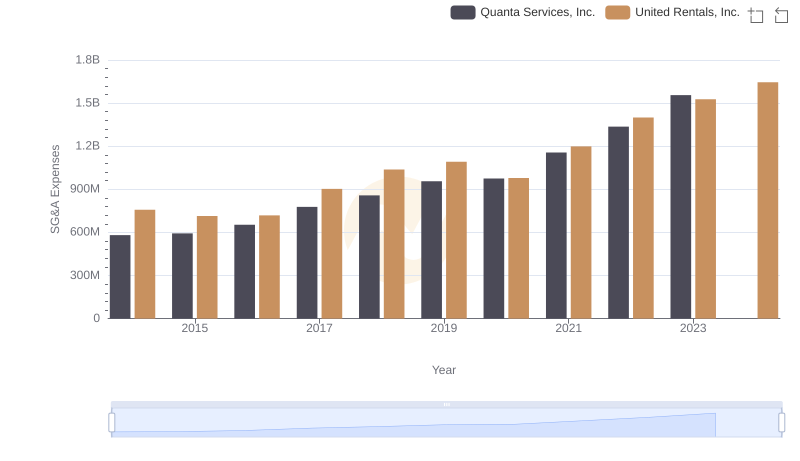
United Rentals, Inc. and Quanta Services, Inc.: SG&A Spending Patterns Compared
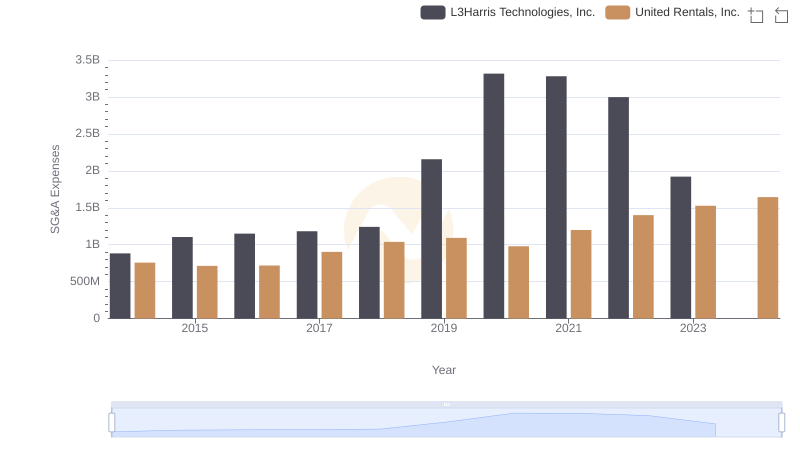
United Rentals, Inc. vs L3Harris Technologies, Inc.: SG&A Expense Trends
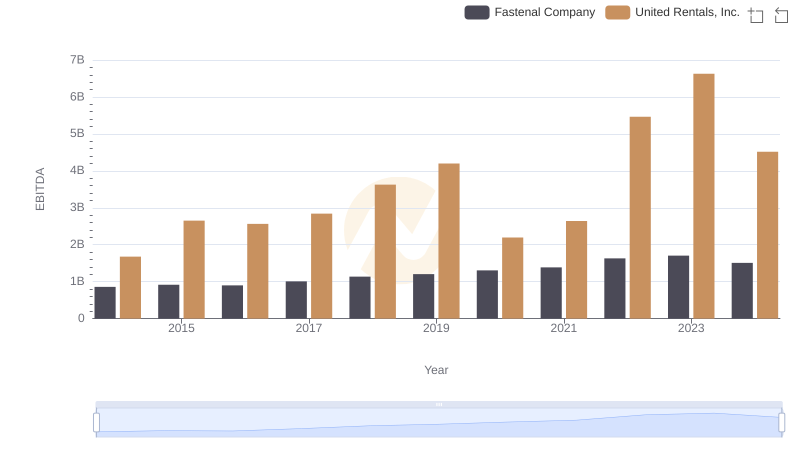
EBITDA Analysis: Evaluating United Rentals, Inc. Against Fastenal Company
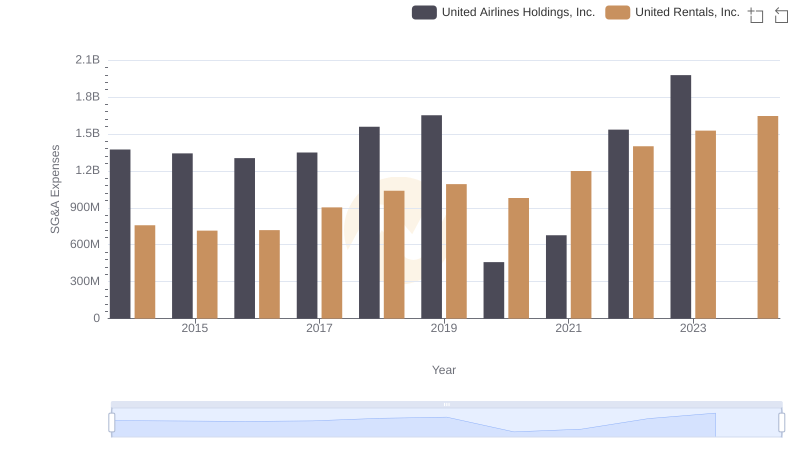
SG&A Efficiency Analysis: Comparing United Rentals, Inc. and United Airlines Holdings, Inc.
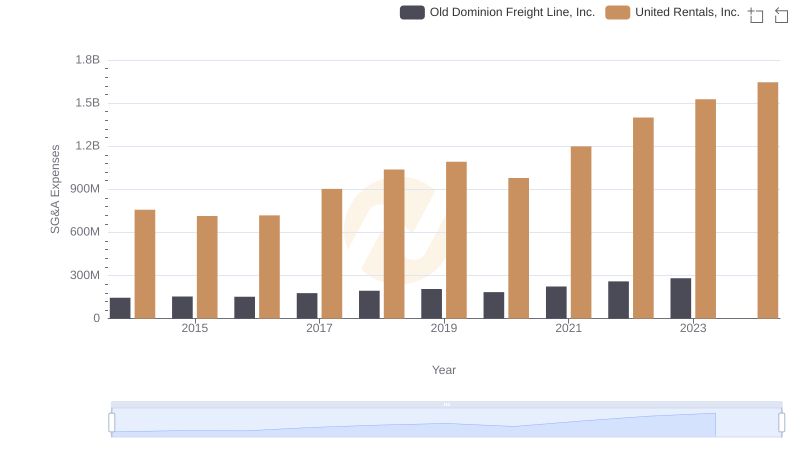
Cost Management Insights: SG&A Expenses for United Rentals, Inc. and Old Dominion Freight Line, Inc.