| __timestamp | Axon Enterprise, Inc. | United Rentals, Inc. |
|---|---|---|
| Wednesday, January 1, 2014 | 54158000 | 758000000 |
| Thursday, January 1, 2015 | 69698000 | 714000000 |
| Friday, January 1, 2016 | 108076000 | 719000000 |
| Sunday, January 1, 2017 | 138692000 | 903000000 |
| Monday, January 1, 2018 | 156886000 | 1038000000 |
| Tuesday, January 1, 2019 | 212959000 | 1092000000 |
| Wednesday, January 1, 2020 | 307286000 | 979000000 |
| Friday, January 1, 2021 | 515007000 | 1199000000 |
| Saturday, January 1, 2022 | 401575000 | 1400000000 |
| Sunday, January 1, 2023 | 496874000 | 1527000000 |
| Monday, January 1, 2024 | 1645000000 |
Unleashing insights
Over the past decade, United Rentals, Inc. and Axon Enterprise, Inc. have showcased distinct trends in their Selling, General, and Administrative (SG&A) expenses. United Rentals, a leader in equipment rental, consistently outpaces Axon, a public safety technology company, in SG&A spending. From 2014 to 2023, United Rentals' expenses grew by approximately 101%, peaking at 1.53 billion in 2023. In contrast, Axon saw a staggering 817% increase, reaching 497 million in the same year.
United Rentals' steady growth reflects its expansive market strategy, while Axon's rapid increase highlights its aggressive investment in innovation and expansion. Notably, 2024 data for Axon is missing, suggesting potential strategic shifts or reporting delays. These trends offer valuable insights into each company's operational focus and market positioning, providing a window into their future trajectories.
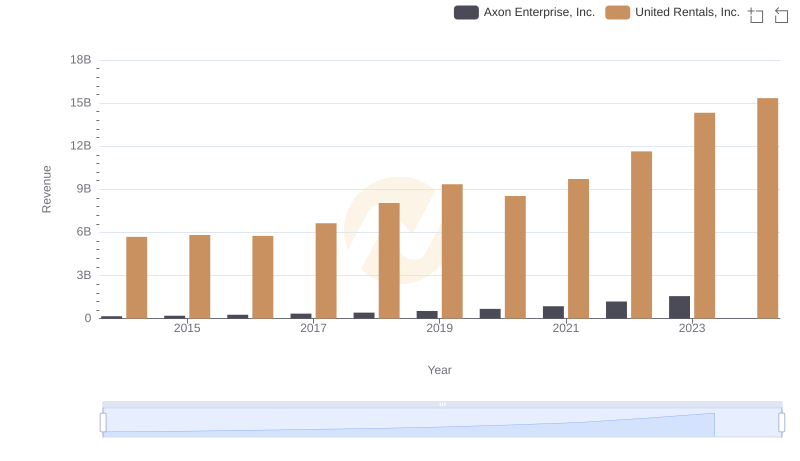
Breaking Down Revenue Trends: United Rentals, Inc. vs Axon Enterprise, Inc.
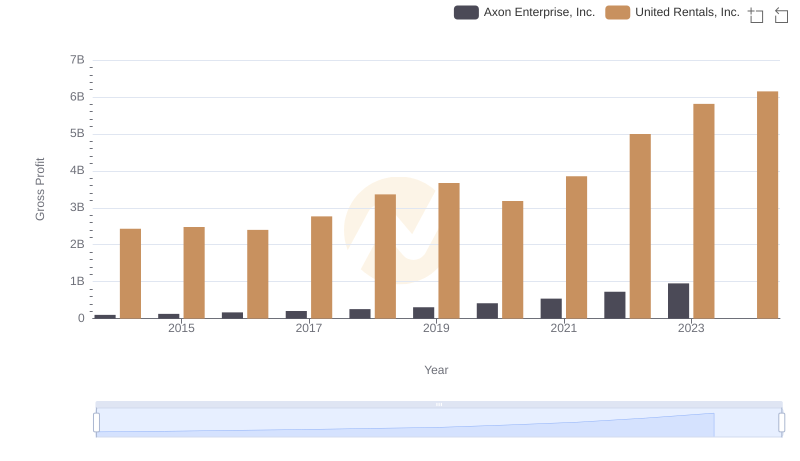
United Rentals, Inc. vs Axon Enterprise, Inc.: A Gross Profit Performance Breakdown
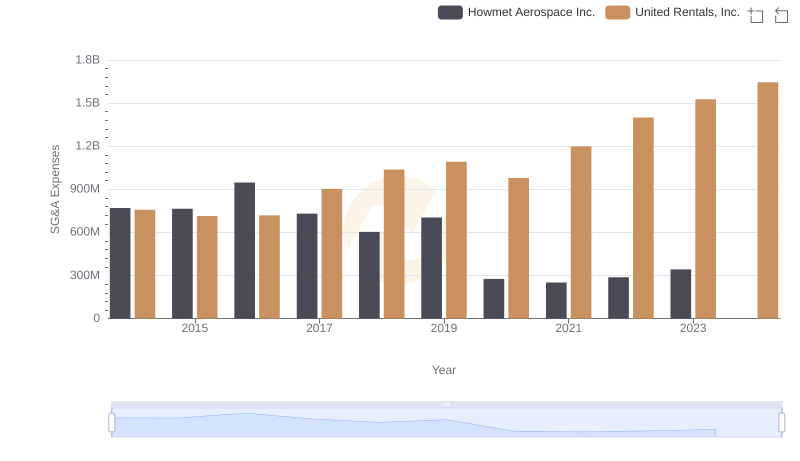
Operational Costs Compared: SG&A Analysis of United Rentals, Inc. and Howmet Aerospace Inc.
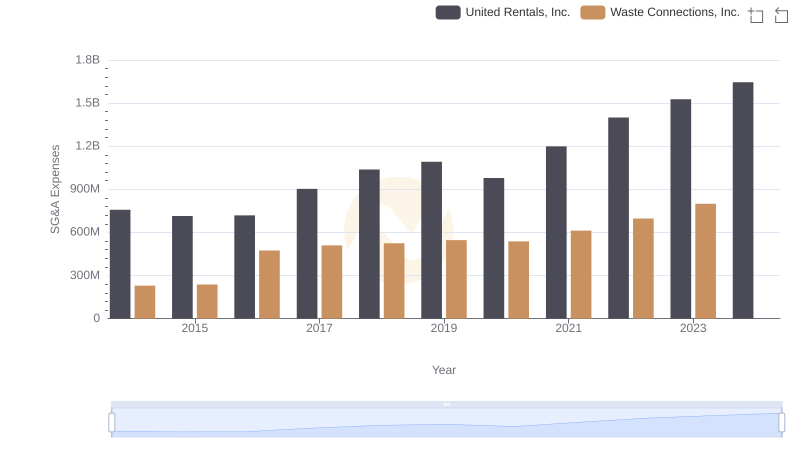
Selling, General, and Administrative Costs: United Rentals, Inc. vs Waste Connections, Inc.
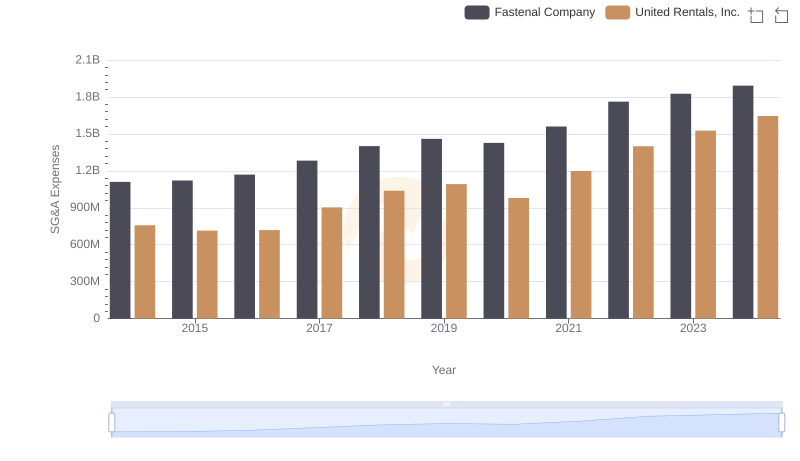
Selling, General, and Administrative Costs: United Rentals, Inc. vs Fastenal Company
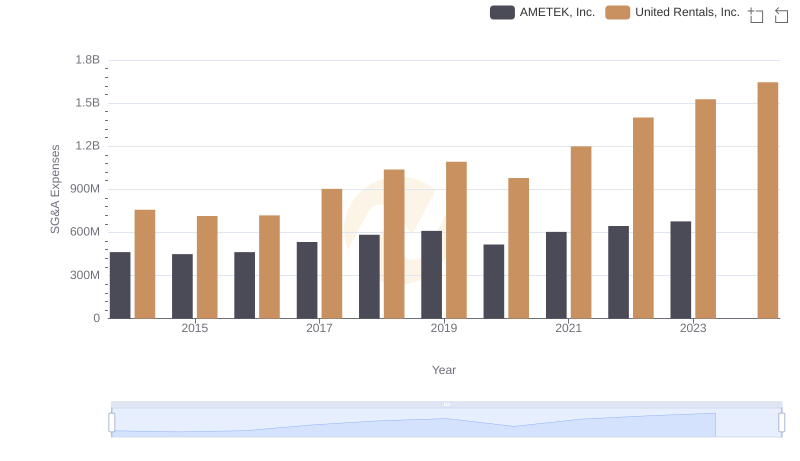
United Rentals, Inc. vs AMETEK, Inc.: SG&A Expense Trends
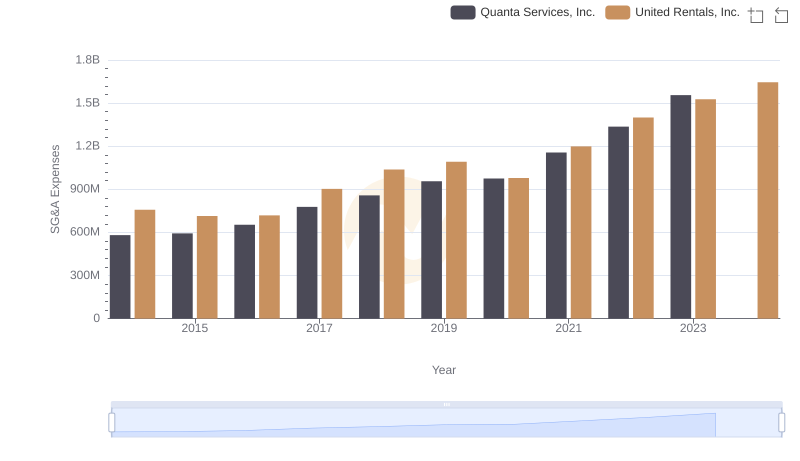
United Rentals, Inc. and Quanta Services, Inc.: SG&A Spending Patterns Compared
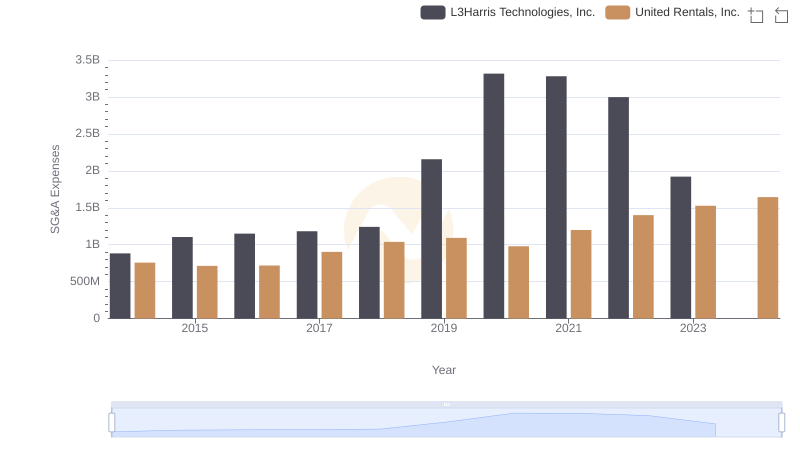
United Rentals, Inc. vs L3Harris Technologies, Inc.: SG&A Expense Trends
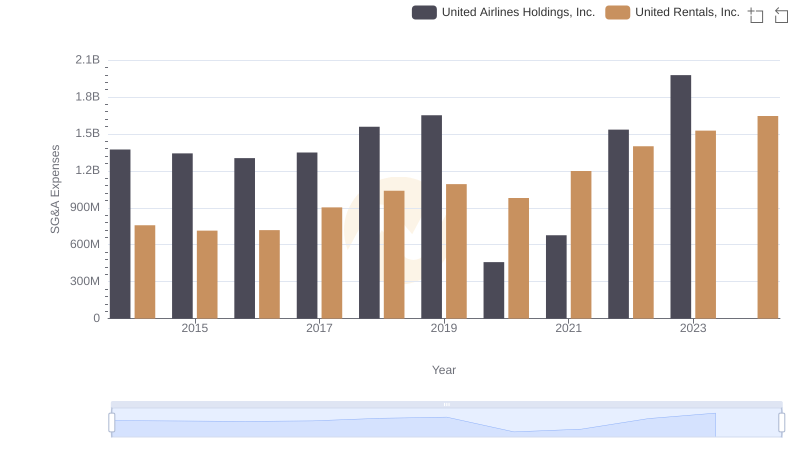
SG&A Efficiency Analysis: Comparing United Rentals, Inc. and United Airlines Holdings, Inc.
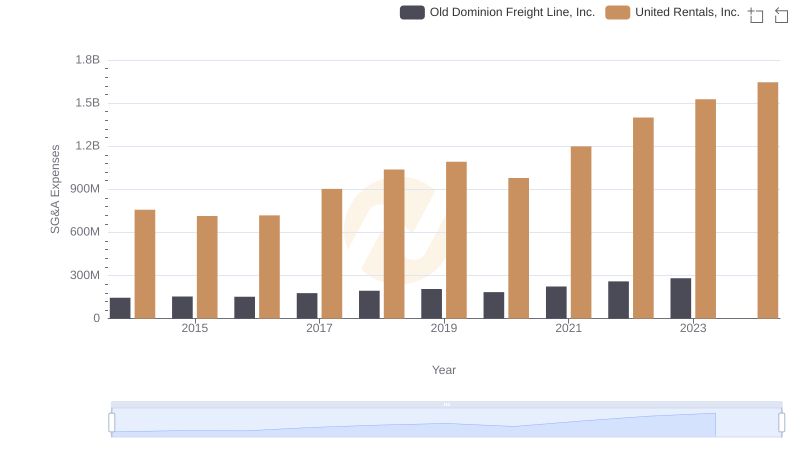
Cost Management Insights: SG&A Expenses for United Rentals, Inc. and Old Dominion Freight Line, Inc.